Simple Nomad Dashboard
A dashboard for HashiCorp Nomad https://www.nomadproject.io/
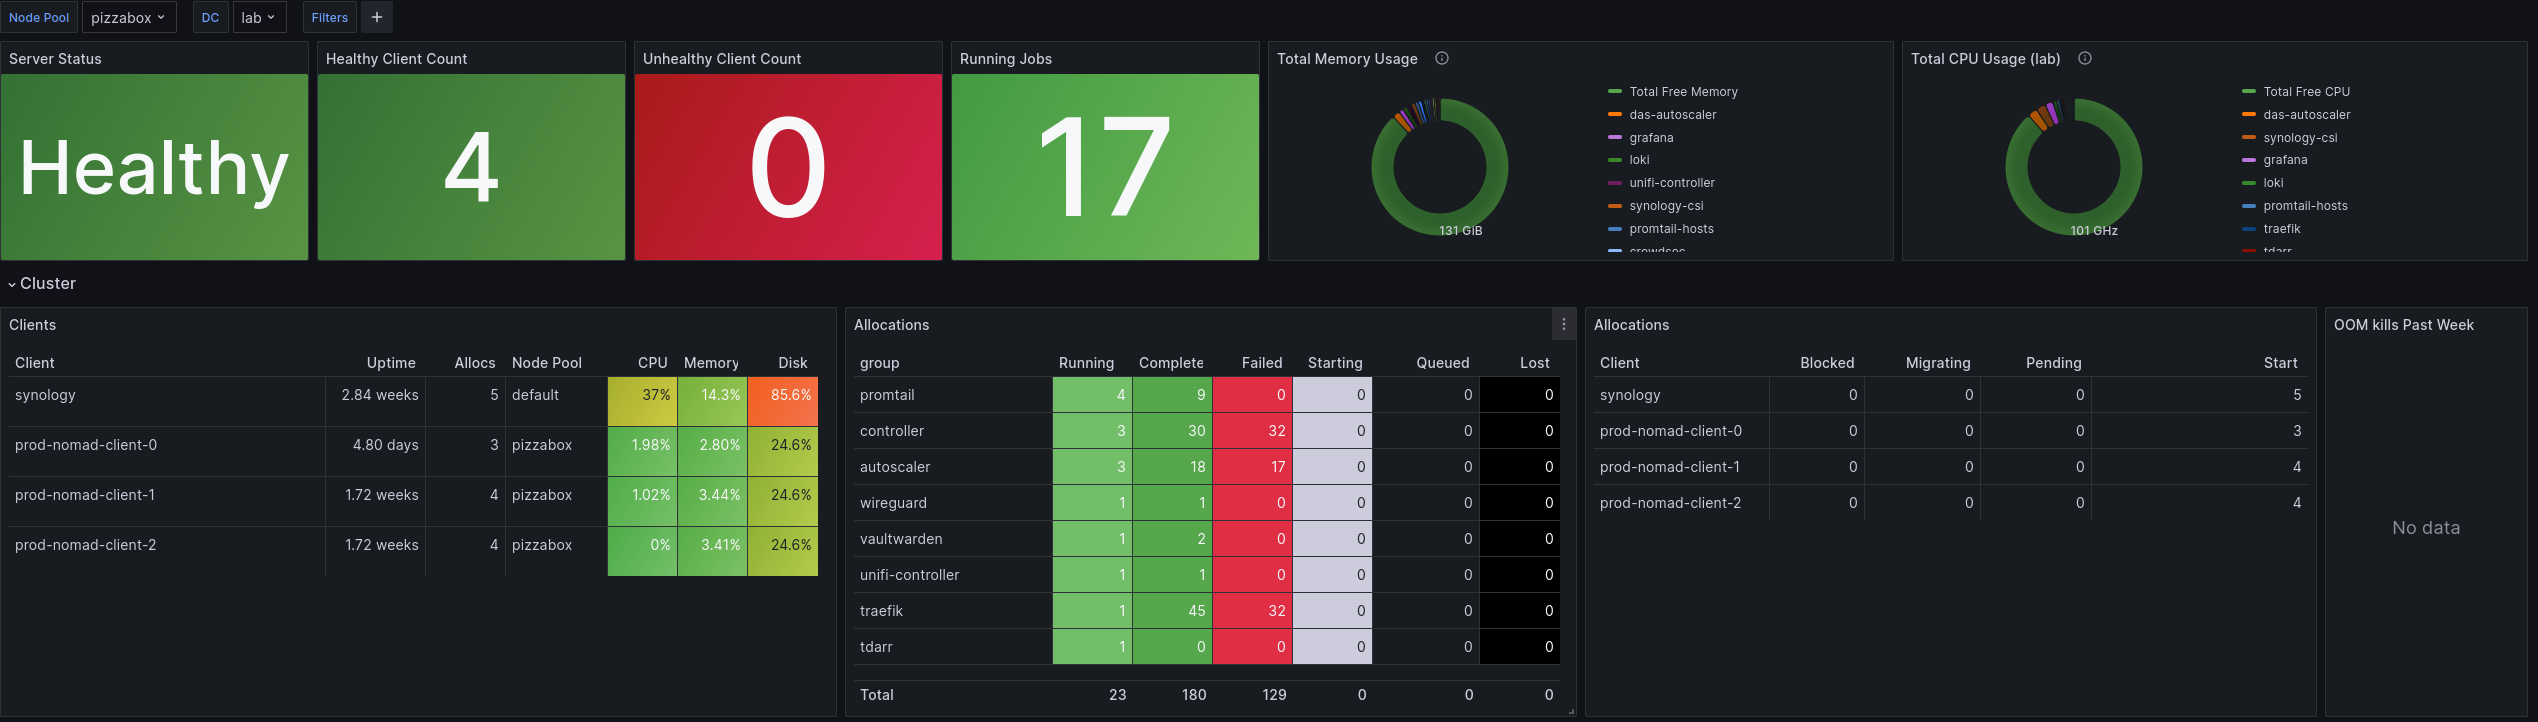
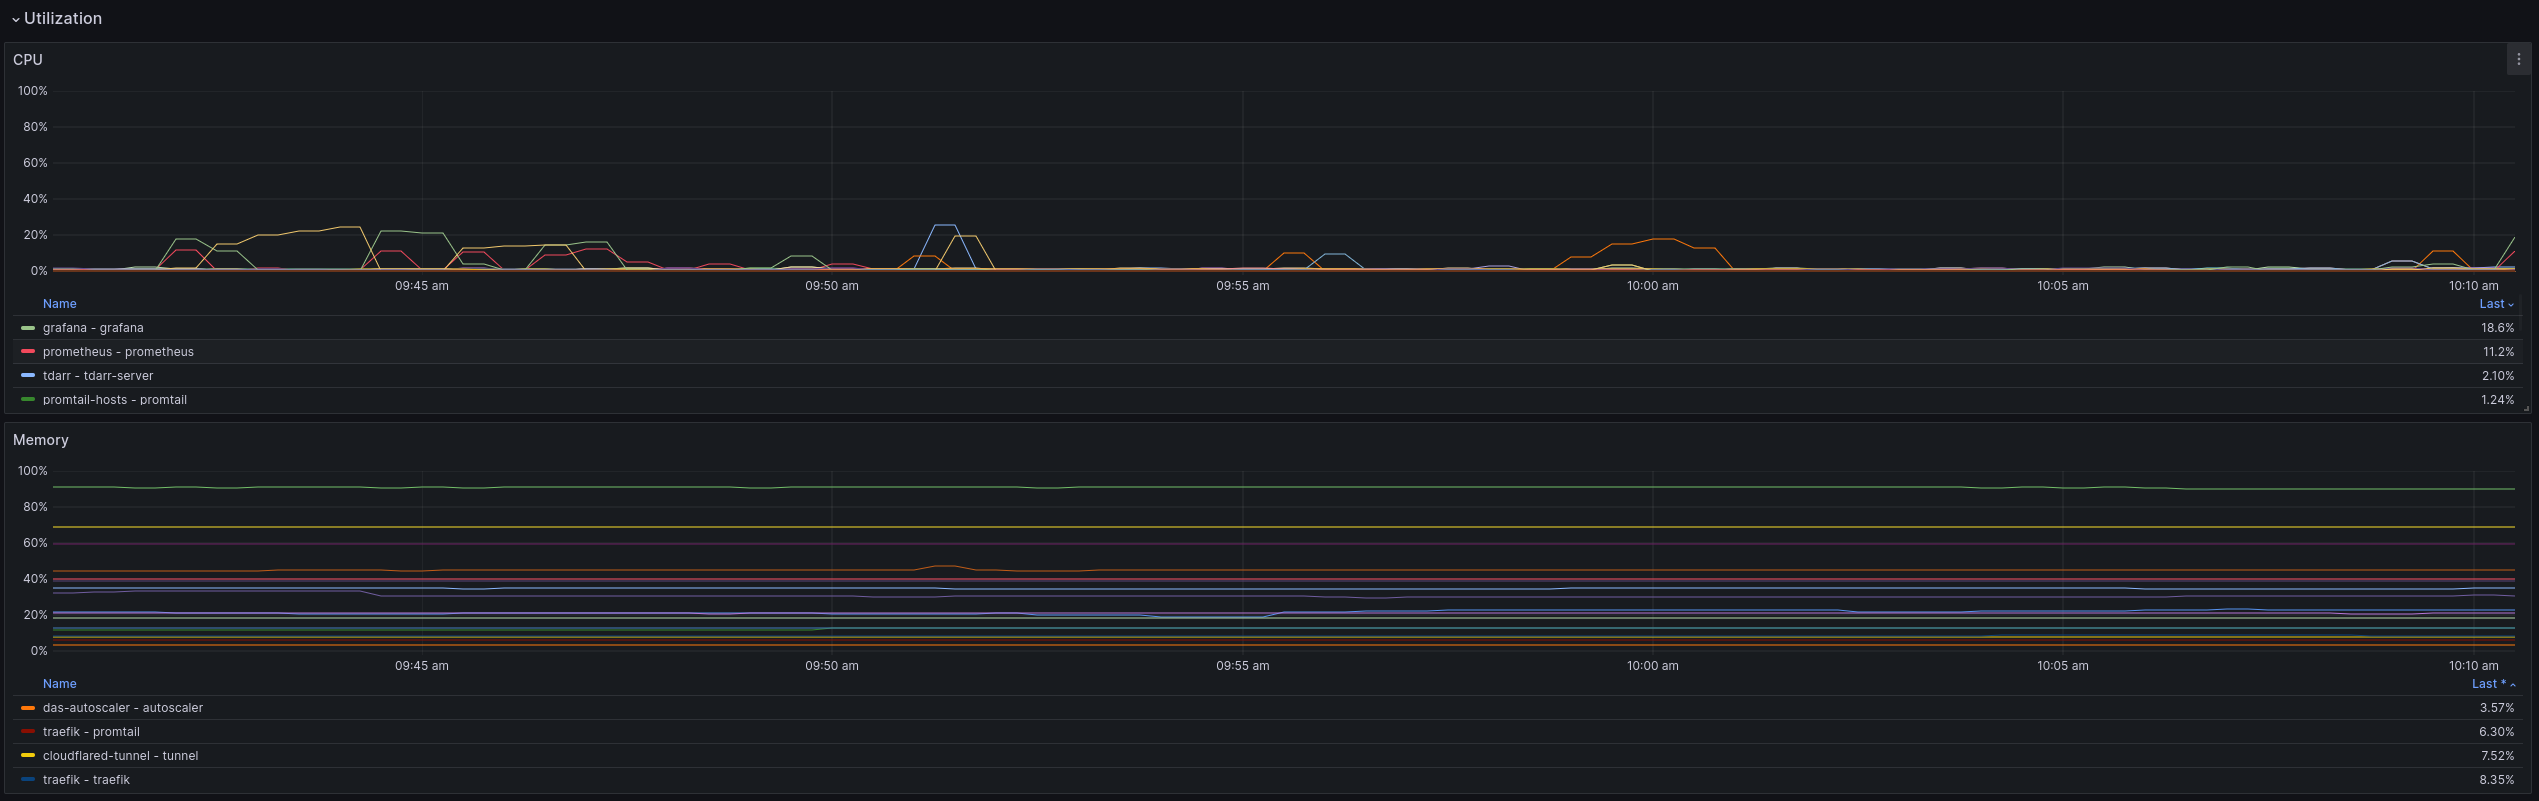
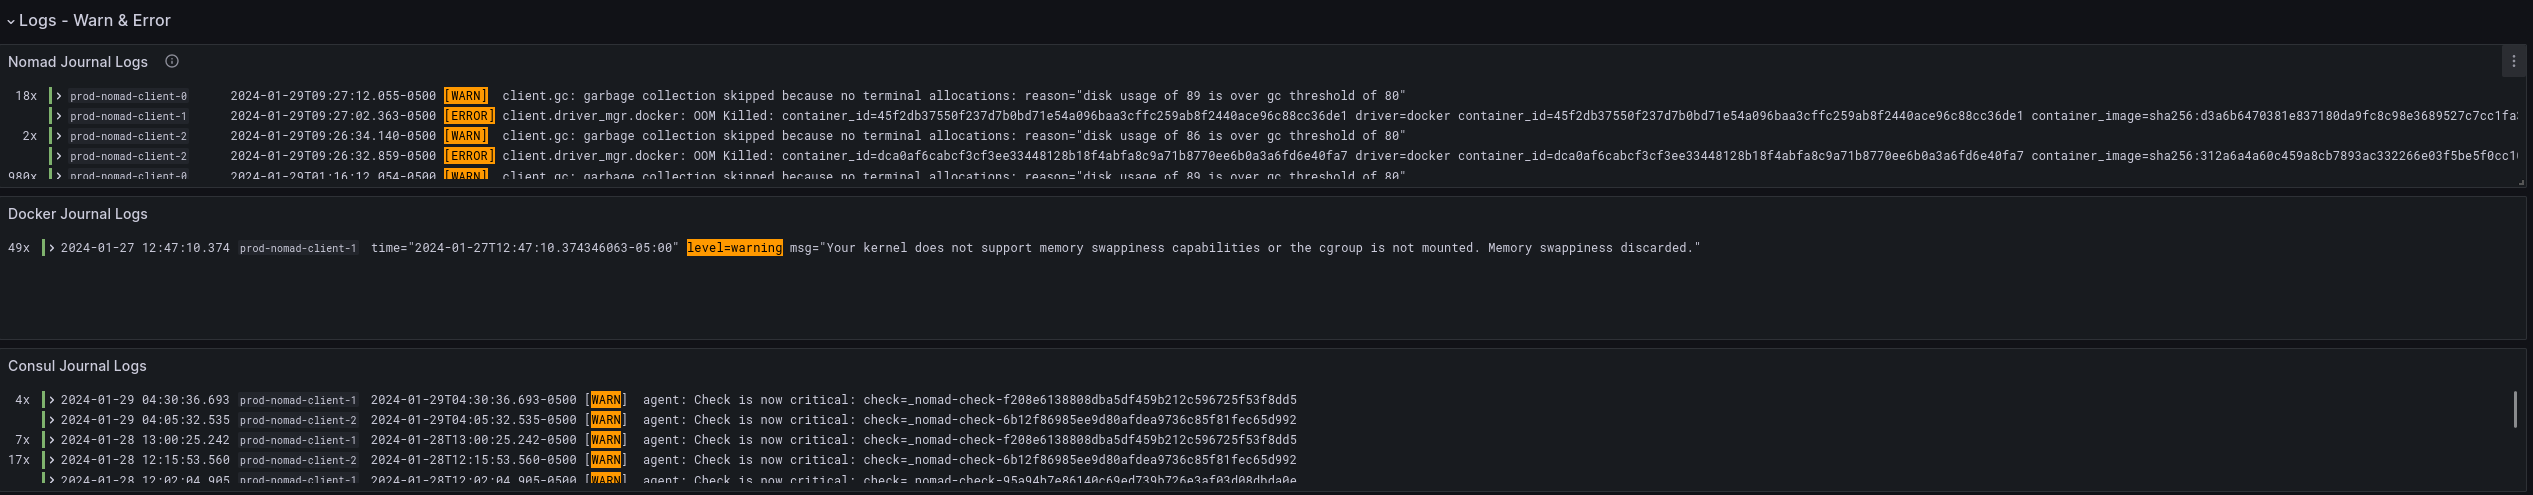
Simple Dashboard for Nomad that monitors Node health status via Infinity, Metrics via Prometheus, and Nomad, Docker, and Consul journal logs via Loki.
4/24 - Added ability to filter jobs by namespace. Removed Nodepool filter since it wasn't doing anything.
Setup:
1 - Set your Prometheus and Loki datasource endpoints. I personally use Promtail to send logs to Loki.
2 - Set the $endpoint variable to your Nomad API endpoint. If you use SSL and/or Auth (ACL or Oauth), you'll need to set those headers under the top left 3 panels: Server Status, Healthy Client Count, Unhealthy Client Count
Data source config
Collector config:
Upload an updated version of an exported dashboard.json file from Grafana
| Revision | Description | Created | |
|---|---|---|---|
| Download |
Nomad
Easily monitor Nomad, the container orchestrator from Hashicorp, with Grafana Cloud's out-of-the-box monitoring solution.
Learn more