Exorde API Demo
Grafana demo dashboard
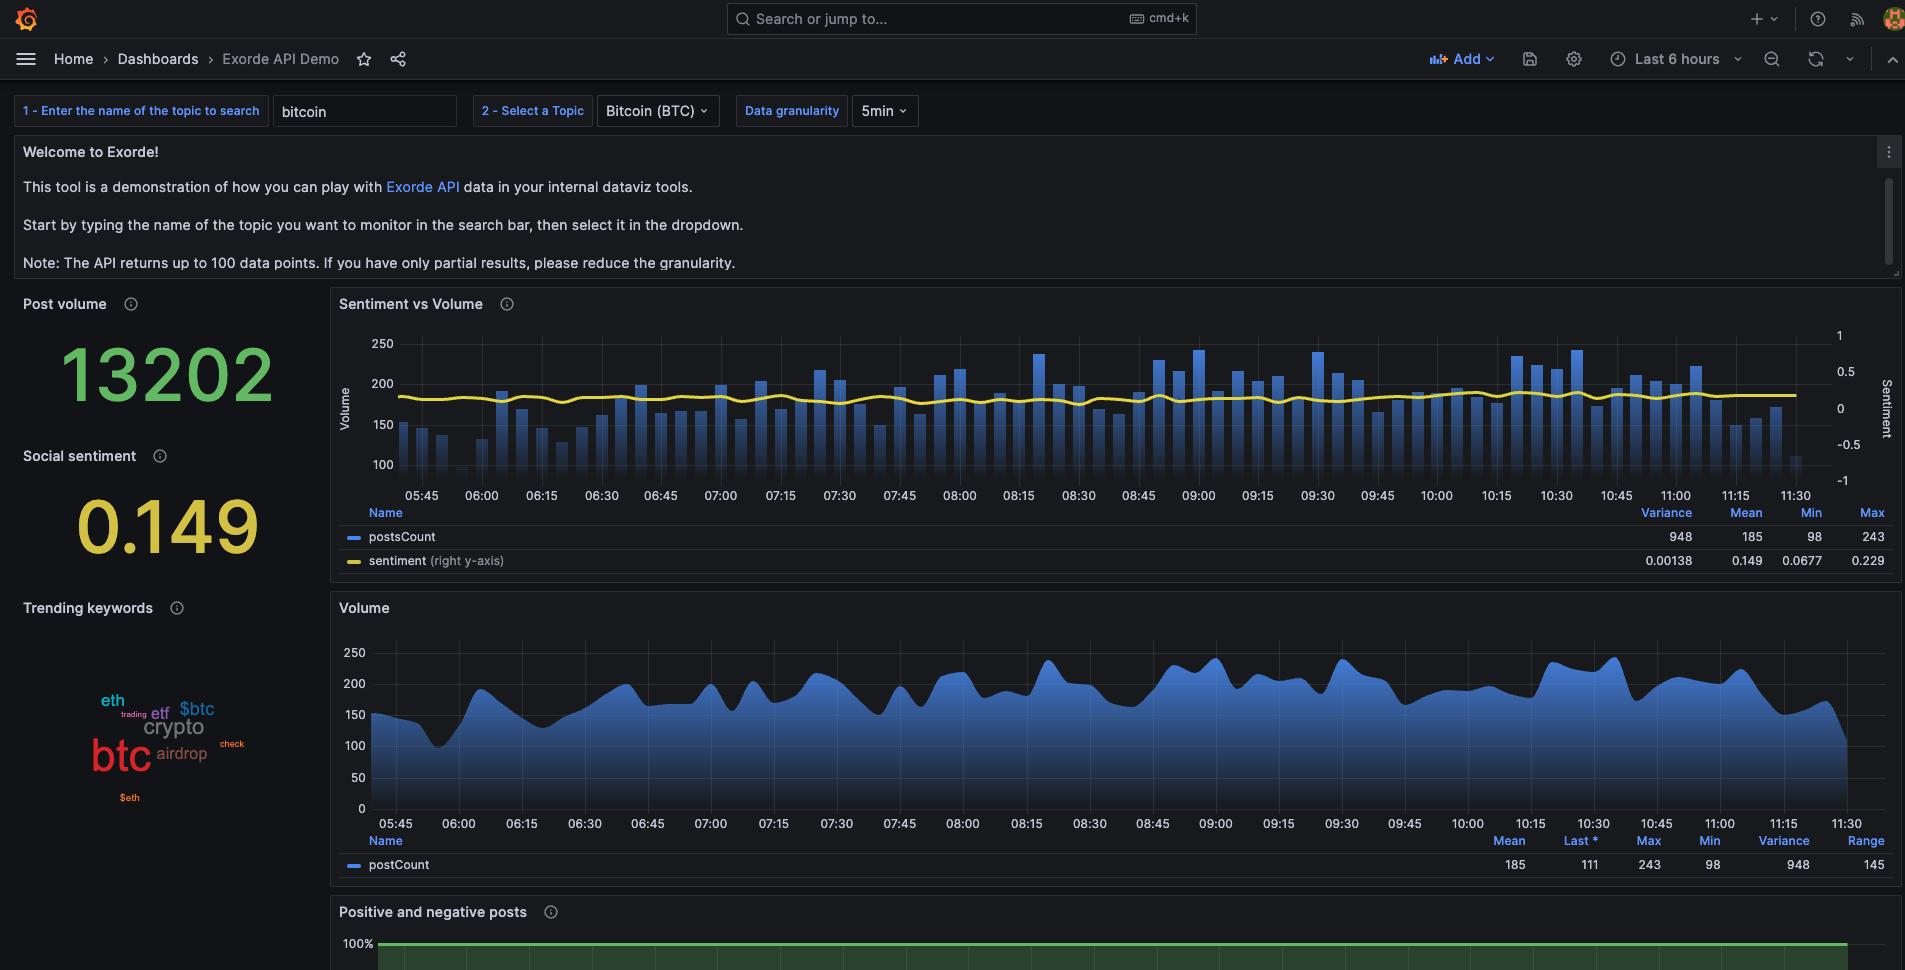
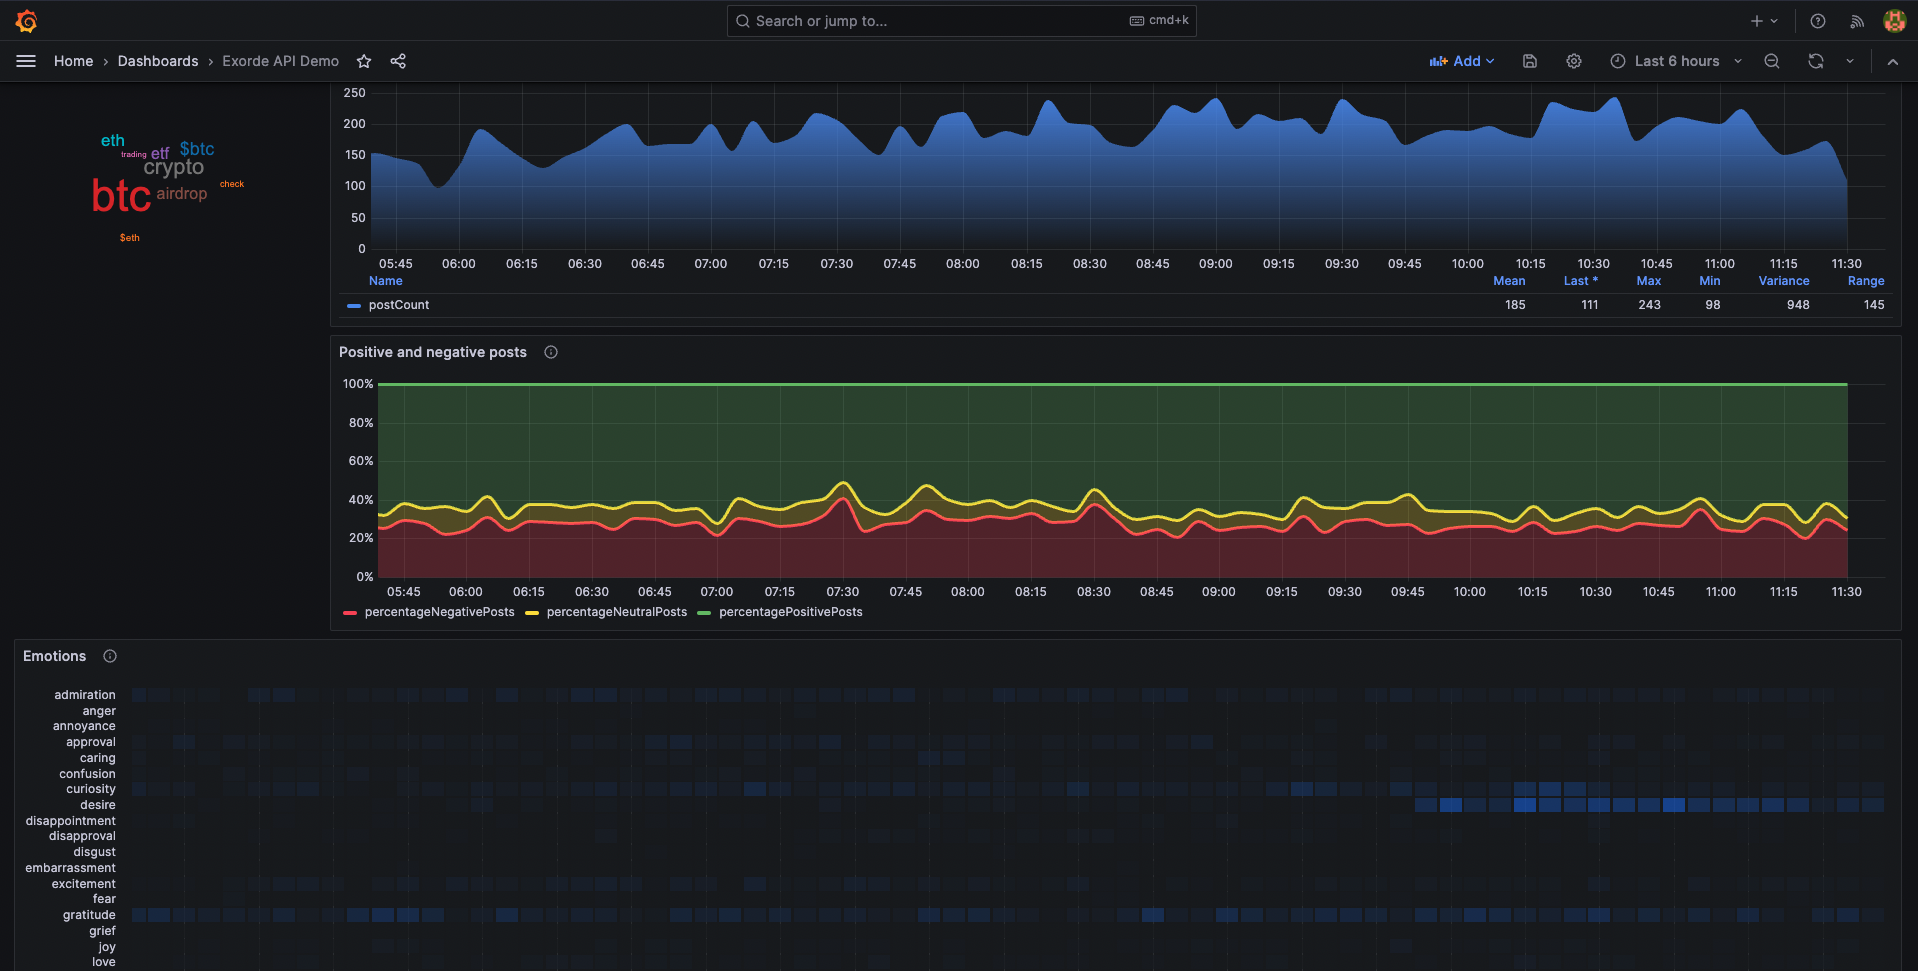
This dashboard is a demonstration of how you can play with Exorde API data in your internal dataviz tools. You can use it as a starting point to build your own dashboard or to explore Exorde API data.
With this dashboard, you can monitor the sentiment, the volume and trending keywords related to any topic tracked by Exorde. Just type the name of the topic you want to monitor in the search bar, then select it in the dropdown.
Installation instructions
Access the Exorde API
First, to use the Exorde API, you need to create an account on Exorde developers portal. You'll get 1000 free credits and an API generated on your first login. Keep it safe, you'll need it to authenticate your requests.
Run Grafana locally
If you don't have a Grafana instance, you can run one locally using a docker container, listening on port 3000:
docker run -d -p 3000:3000 \
  --name=grafana-exorde-demo \
  --env GF_INSTALL_PLUGINS=magnesium-wordcloud-panel,marcusolsson-json-datasource \
  grafana/grafana
Grafana is available at http://localhost:3000. The default username and password are both admin.
Note: If you already have a Grafana instance, ensure that the Word cloud and JSON API plugins are installed.
Connect Grafana to the Exorde API
Add a JSON API connector, to enable Grafana to query the Exorde API:
Go to
Main menu>Connections>Data sources.Click on
Add data source.Type
JSON APIin the search bar.Click on
JSON APIdata source.Fill the form:
- Name:
Exorde API - URL:
https://api.exorde.io - Authentication:
No Authentication - HTTP Headers: add the following headers:
Accept:application/jsonX-Exorde-Api-Version:v1Authorization:Bearer YOUR_API_KEY
- Name:
Click on Save & Test to validate the connection.
Import the dashboard
To import the dashboard:
- Go to
Main menu>Dashboards>New>Import. - Paste the id of the dashboard in the
Grafana.com dashboard URL or IDfield:20322. - Click on
Load. - Select the
Exorde APIdata source. - Click on
Import.
How to use the dashboard
Start by typing the name of the topic you want to monitor in the search bar, then select it in the dropdown.
Note: The API returns up to 1 000 data points. If you have only partial results, please reduce the granularity.
Data source config
Collector config:
Upload an updated version of an exported dashboard.json file from Grafana
| Revision | Description | Created | |
|---|---|---|---|
| Download |