VPP Performance Details
Grafana dashboard for the VPP Prometheus Exporter that ships with VPP 24.02 and newer.
See a detailed writeup on [IPng's website].
This dashboard requires VPP 24.02 or later.
This is a public dashboard like the one described in the article, with cool features and drill downs like:
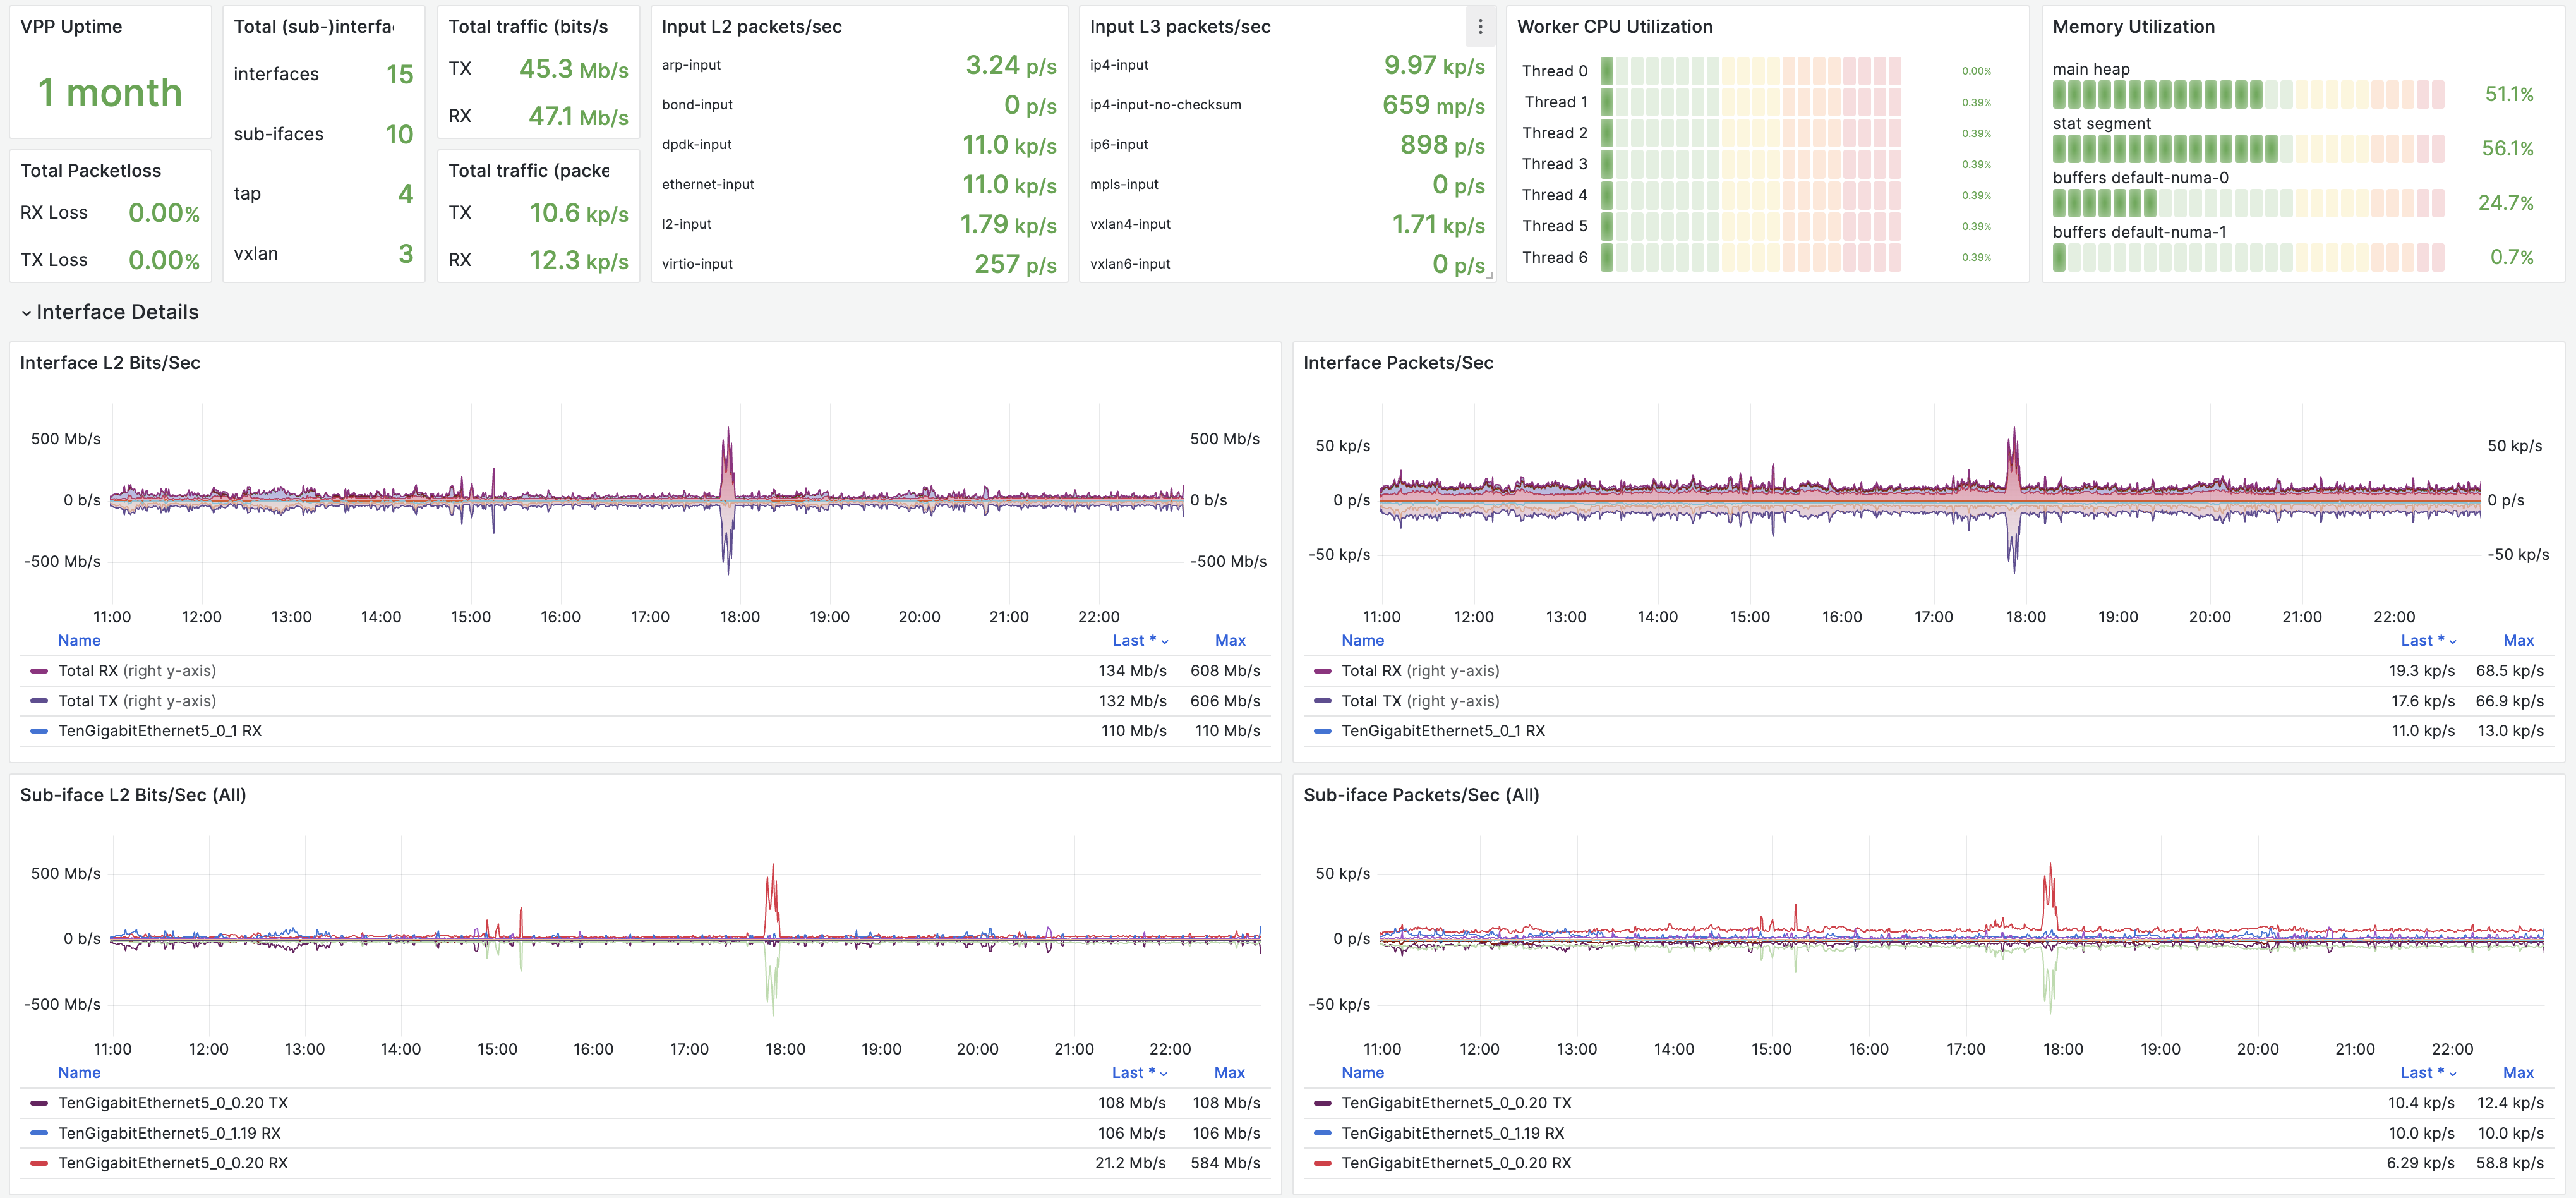
- traffic per interface/sub-interface (packets/bits)
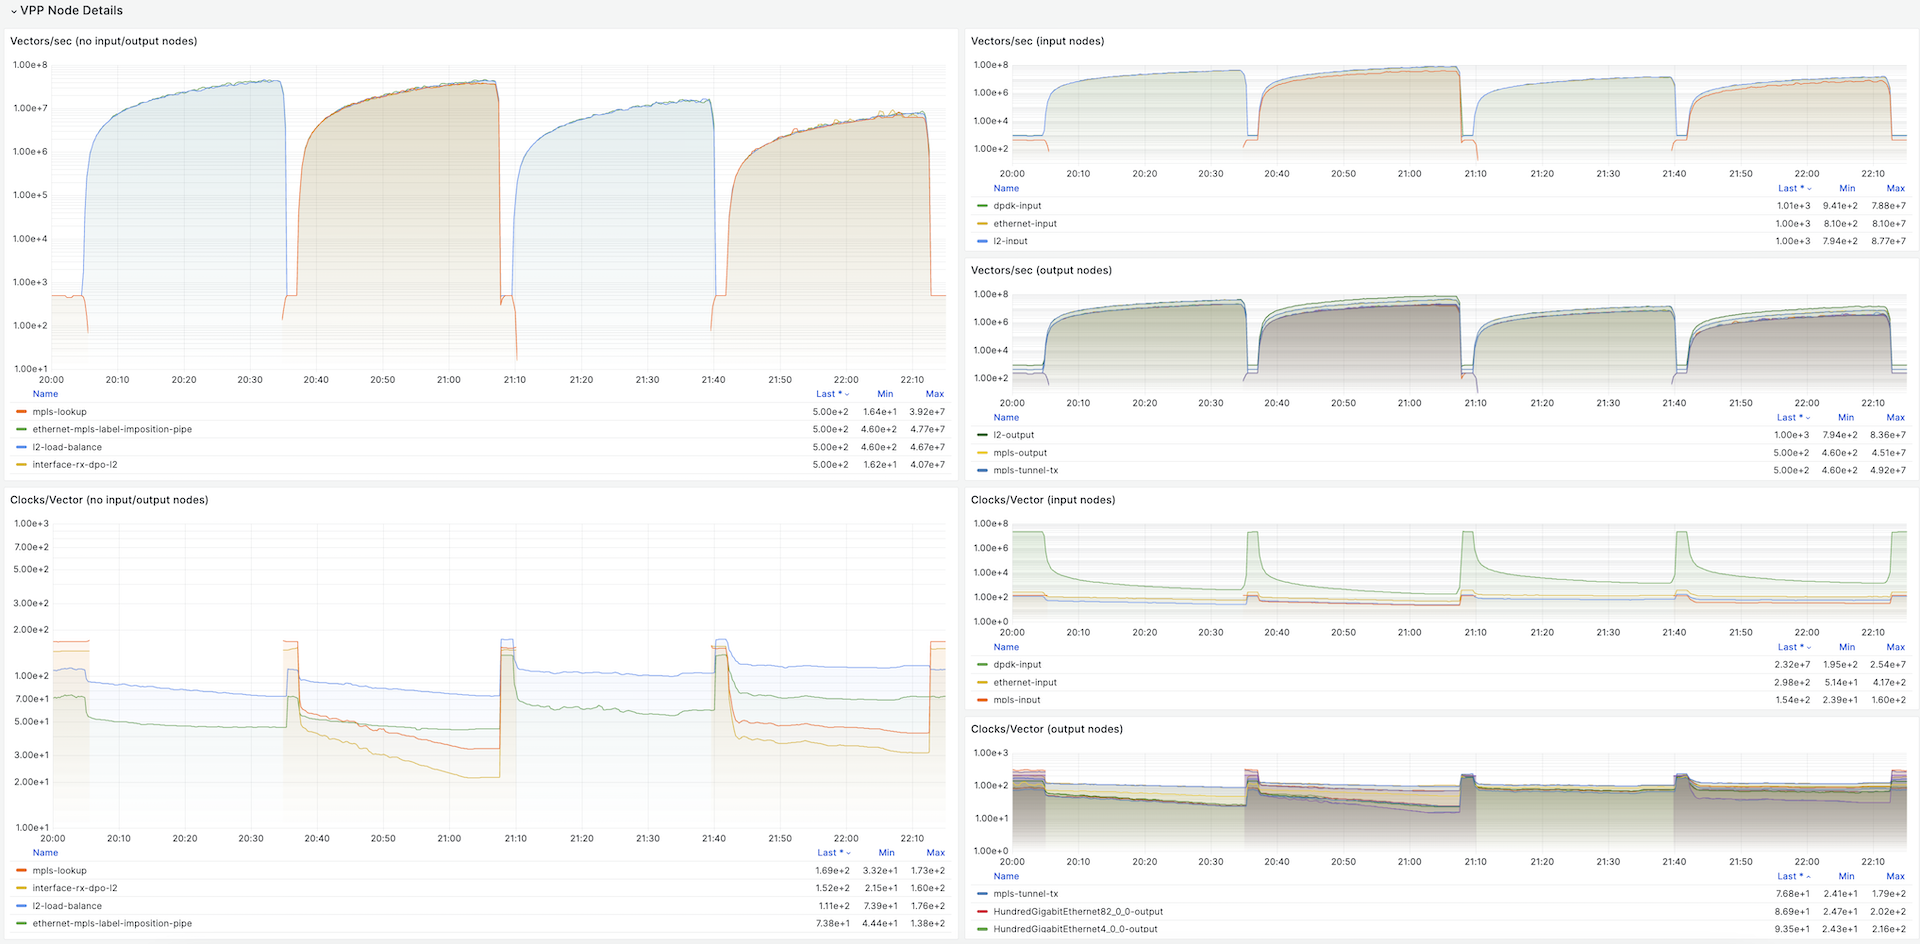
- vectors/sec by node
- clocks/vector by node
- L2 and L3 traffic by type (eg. ethernet, arp, mpls, ip4, ip6)
- cpu % spent per thread, by node
Recommended exporter commandline:
vpp_prometheus_export v2 ^/sys/heartbeat ^/sys/last_stats_clear ^/sys/boottime ^/sys/vector_rate ^/sys/vector_rate_per_worker ^/sys/loops_per_worker ^/sys/num_worker_threads ^/sys/last_update ^/sys/input_rate ^/mem/ ^/nodes/ ^/interfaces/ ^/buffer-pools/
Data source config
Collector type:
Collector plugins:
Collector config:
Revisions
Upload an updated version of an exported dashboard.json file from Grafana
| Revision | Description | Created | |
|---|---|---|---|
| Download |