Nginx_new
Grafana Dashboard for Nginx Web Server.
Enable the sub status module in Nginx, and add the following virtual host config in Nginx Web Server
location /nginx_status {
        	stub_status;
        	allow 127.0.0.1;
        	deny all;
        }
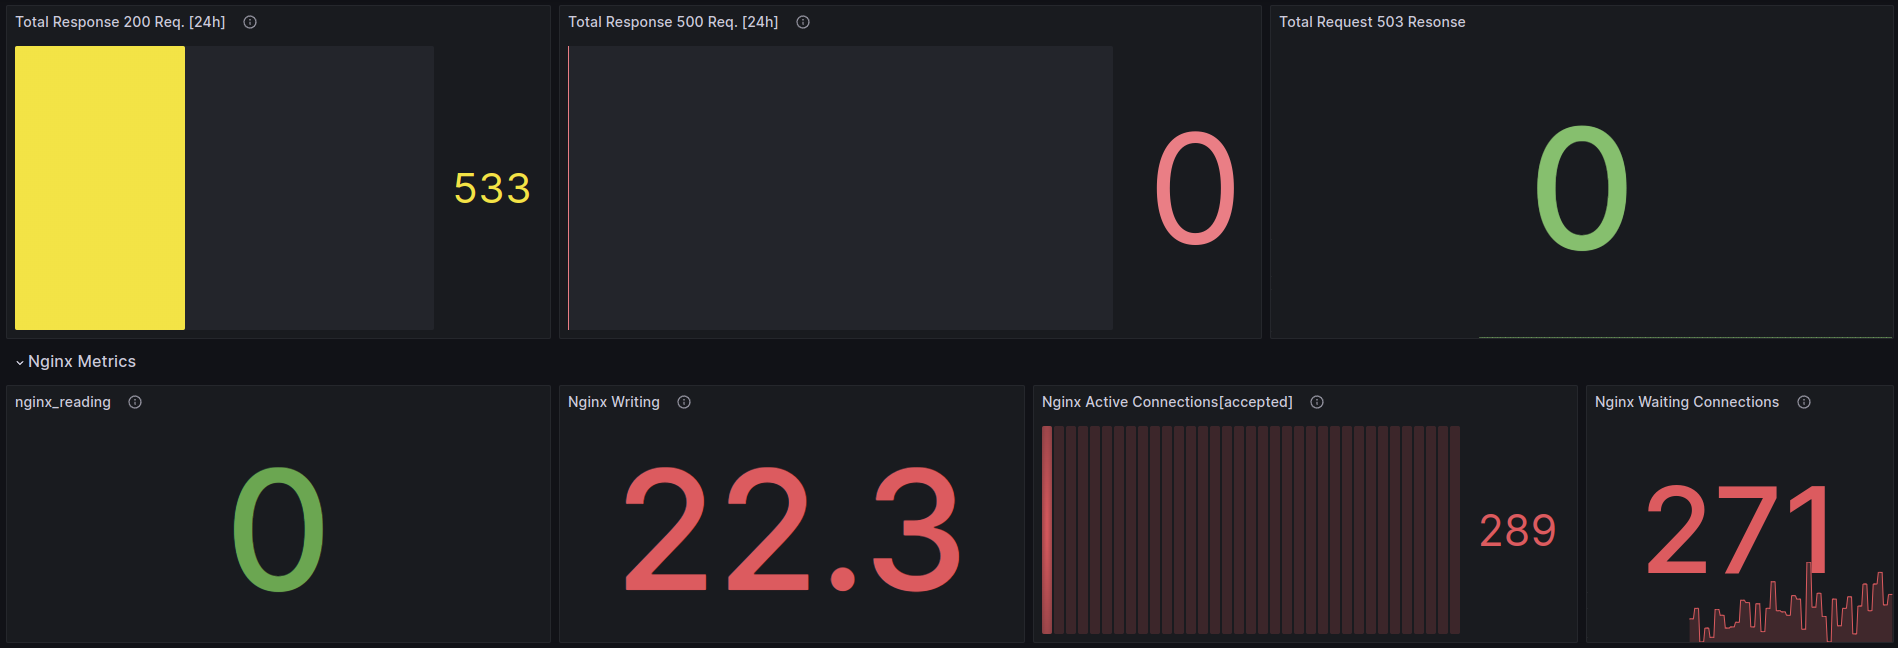
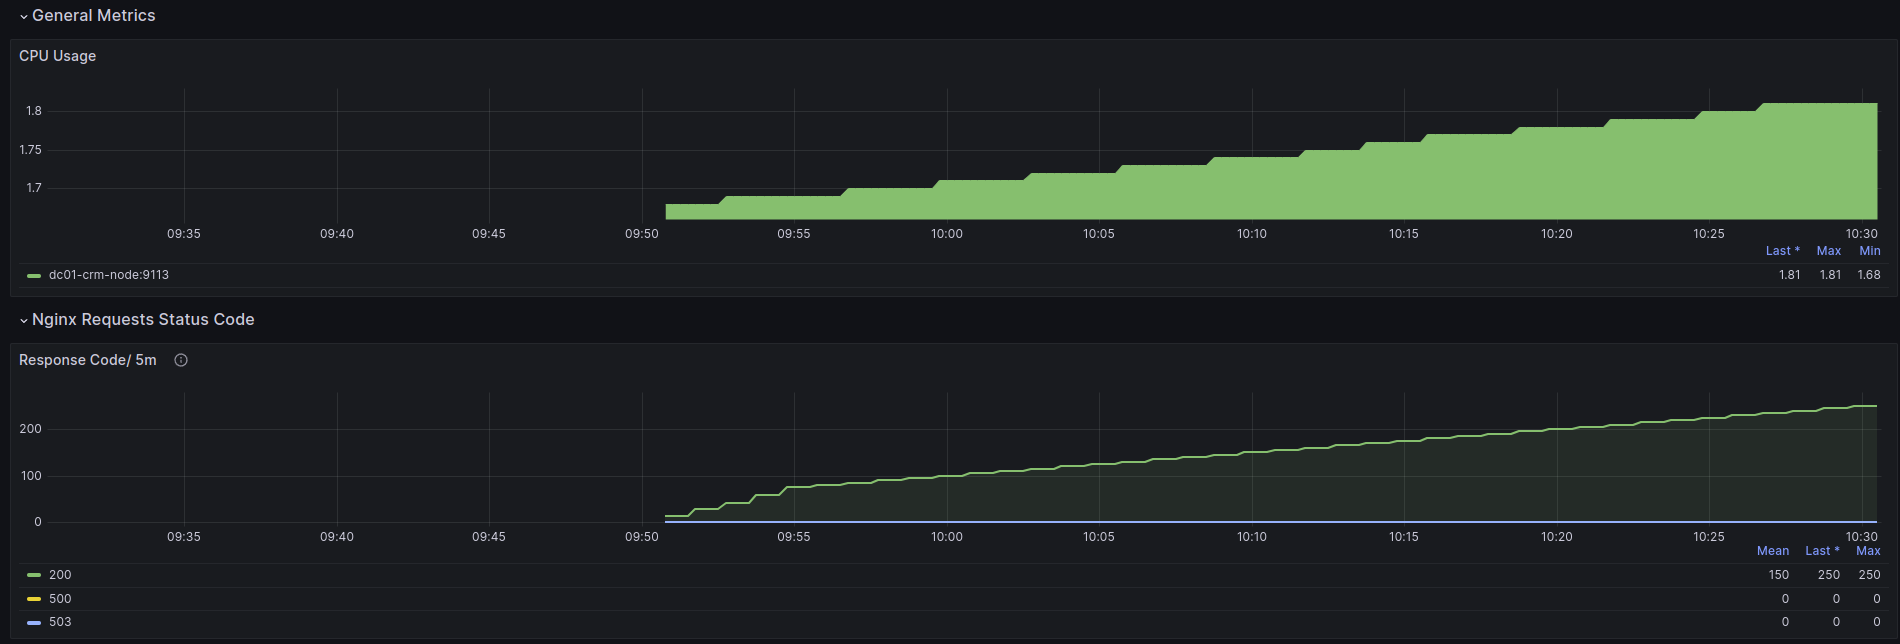
Following the metrics monitor through the dashboard
- UP
- Current CPU Utilization % - Response 2XX / 5m - Total Response 200 Req. [24h] - Response 5XX - Total Request 503 Resonse - Nginx Connections Accepted - Nginx Writing - Nginx Active Connections[accepted] - Nginx Waiting Connections - Handled Request - Nginx Requests - nginx_reading
Data source config
Collector type:
Collector plugins:
Collector config:
Revisions
Upload an updated version of an exported dashboard.json file from Grafana
| Revision | Description | Created | |
|---|---|---|---|
| Download |