Web application components Flux
Python Gunicorn/Flask Web application monitoring using statsd and telegraf.
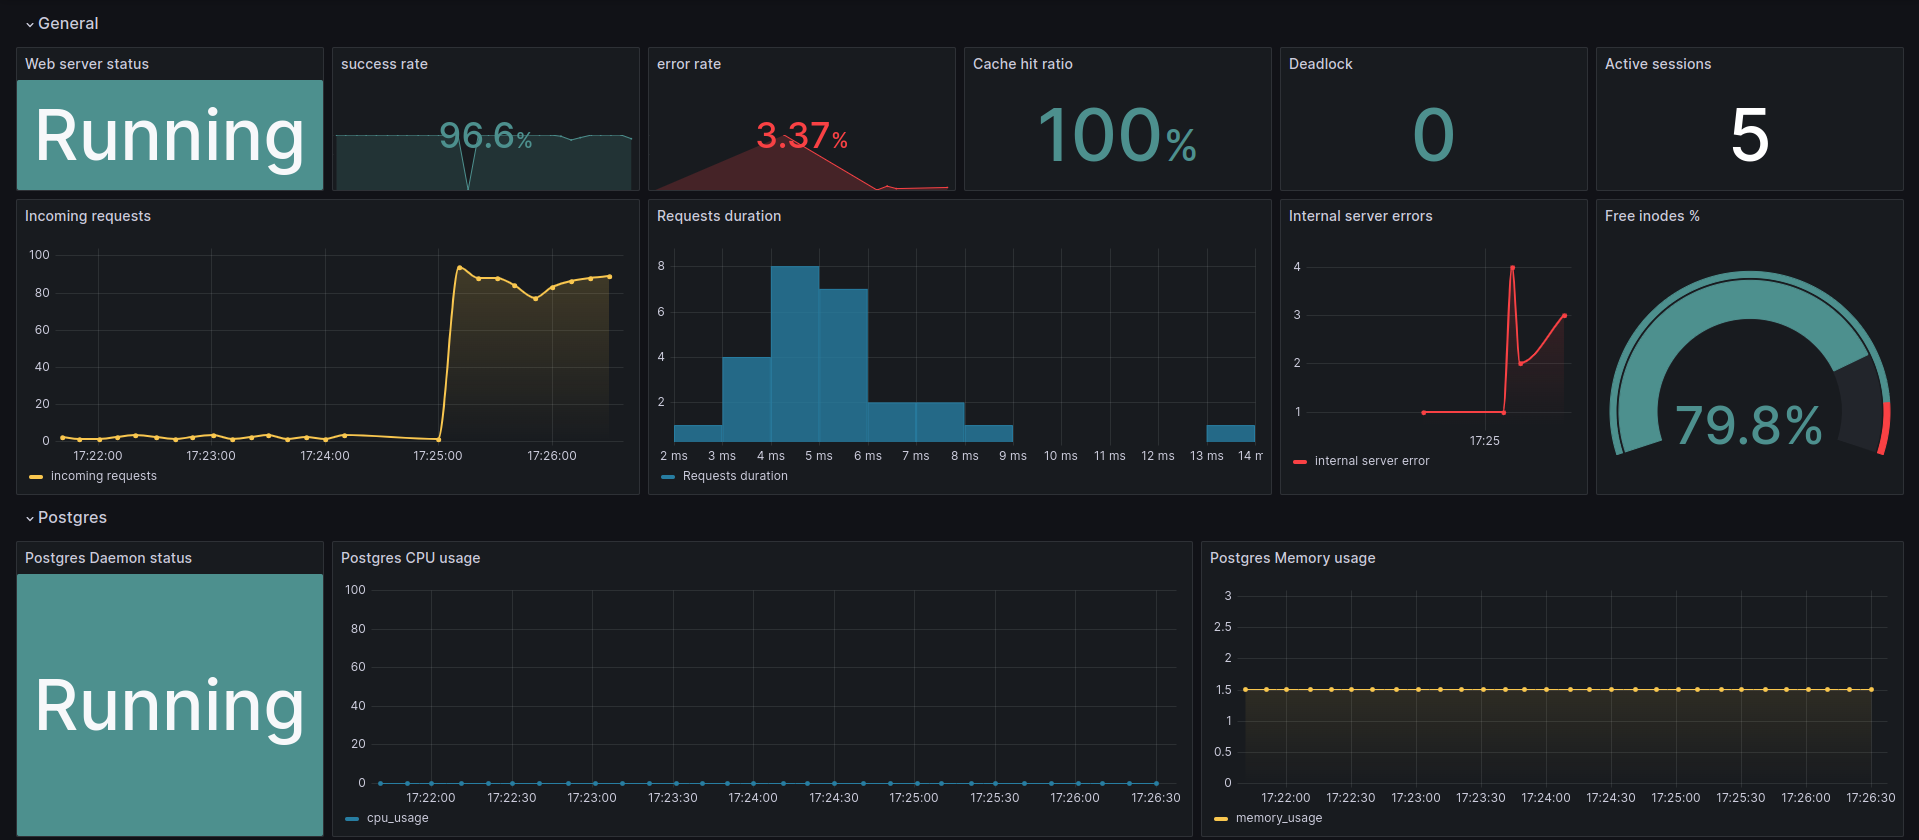
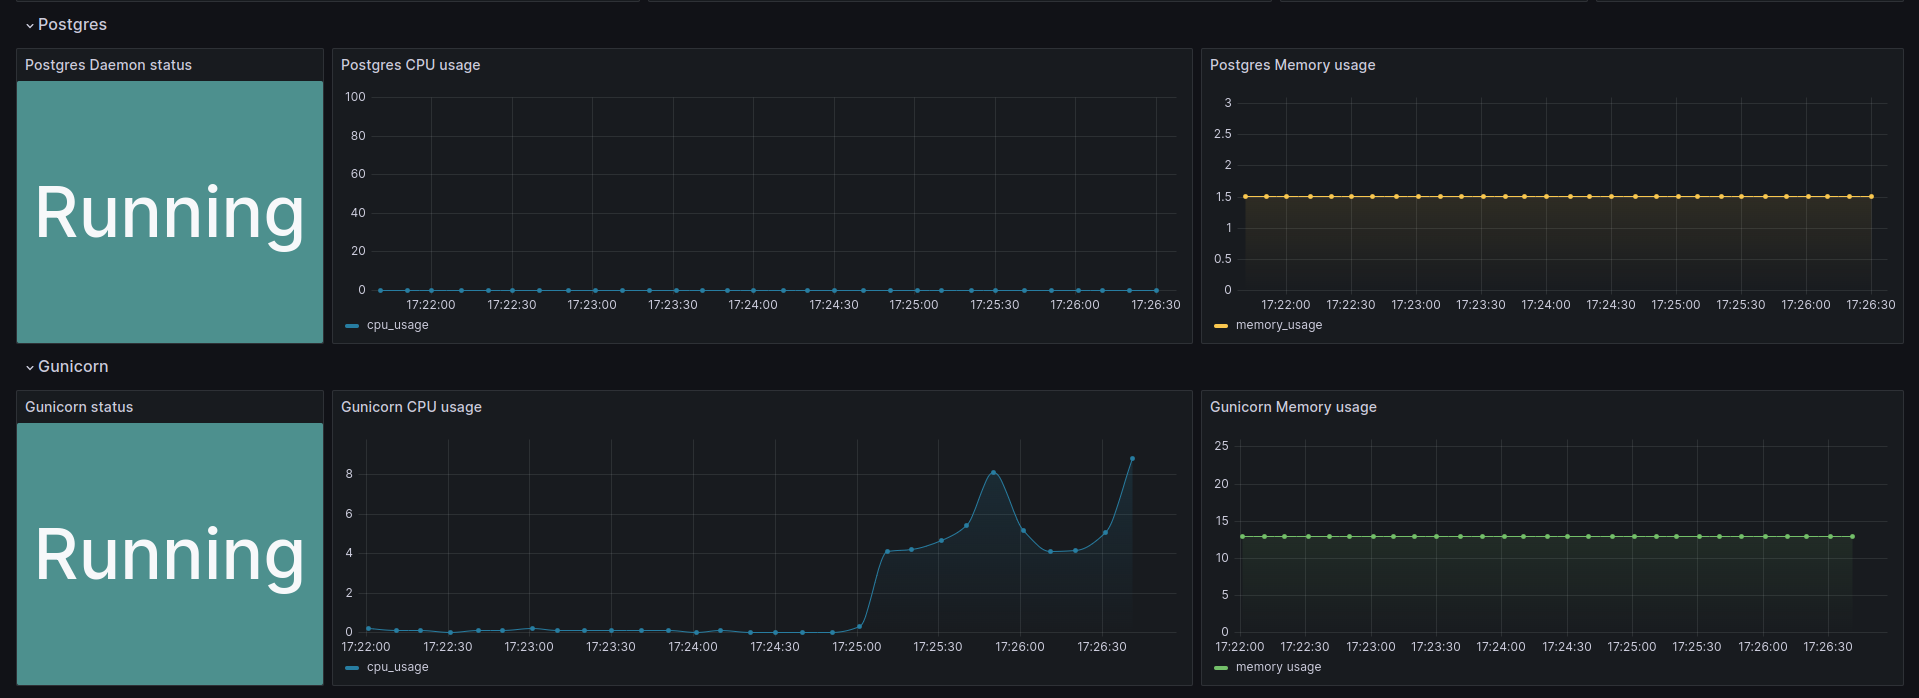
A Grafana dashboard to visualize Gunicorn python web application performance by showing the resource consumption of different components like the Gunicorn processes and Postgres as well as web application-related metrics like the success rate/error rate and average requests duration.
Data source config
Collector type:
Collector plugins:
Collector config:
Revisions
Upload an updated version of an exported dashboard.json file from Grafana
| Revision | Description | Created | |
|---|---|---|---|
| Download |