
Server Metrics (Collectd)
Collectd/Graphite Server metrics dashboard (Load,CPU, Memory, Temp etc)
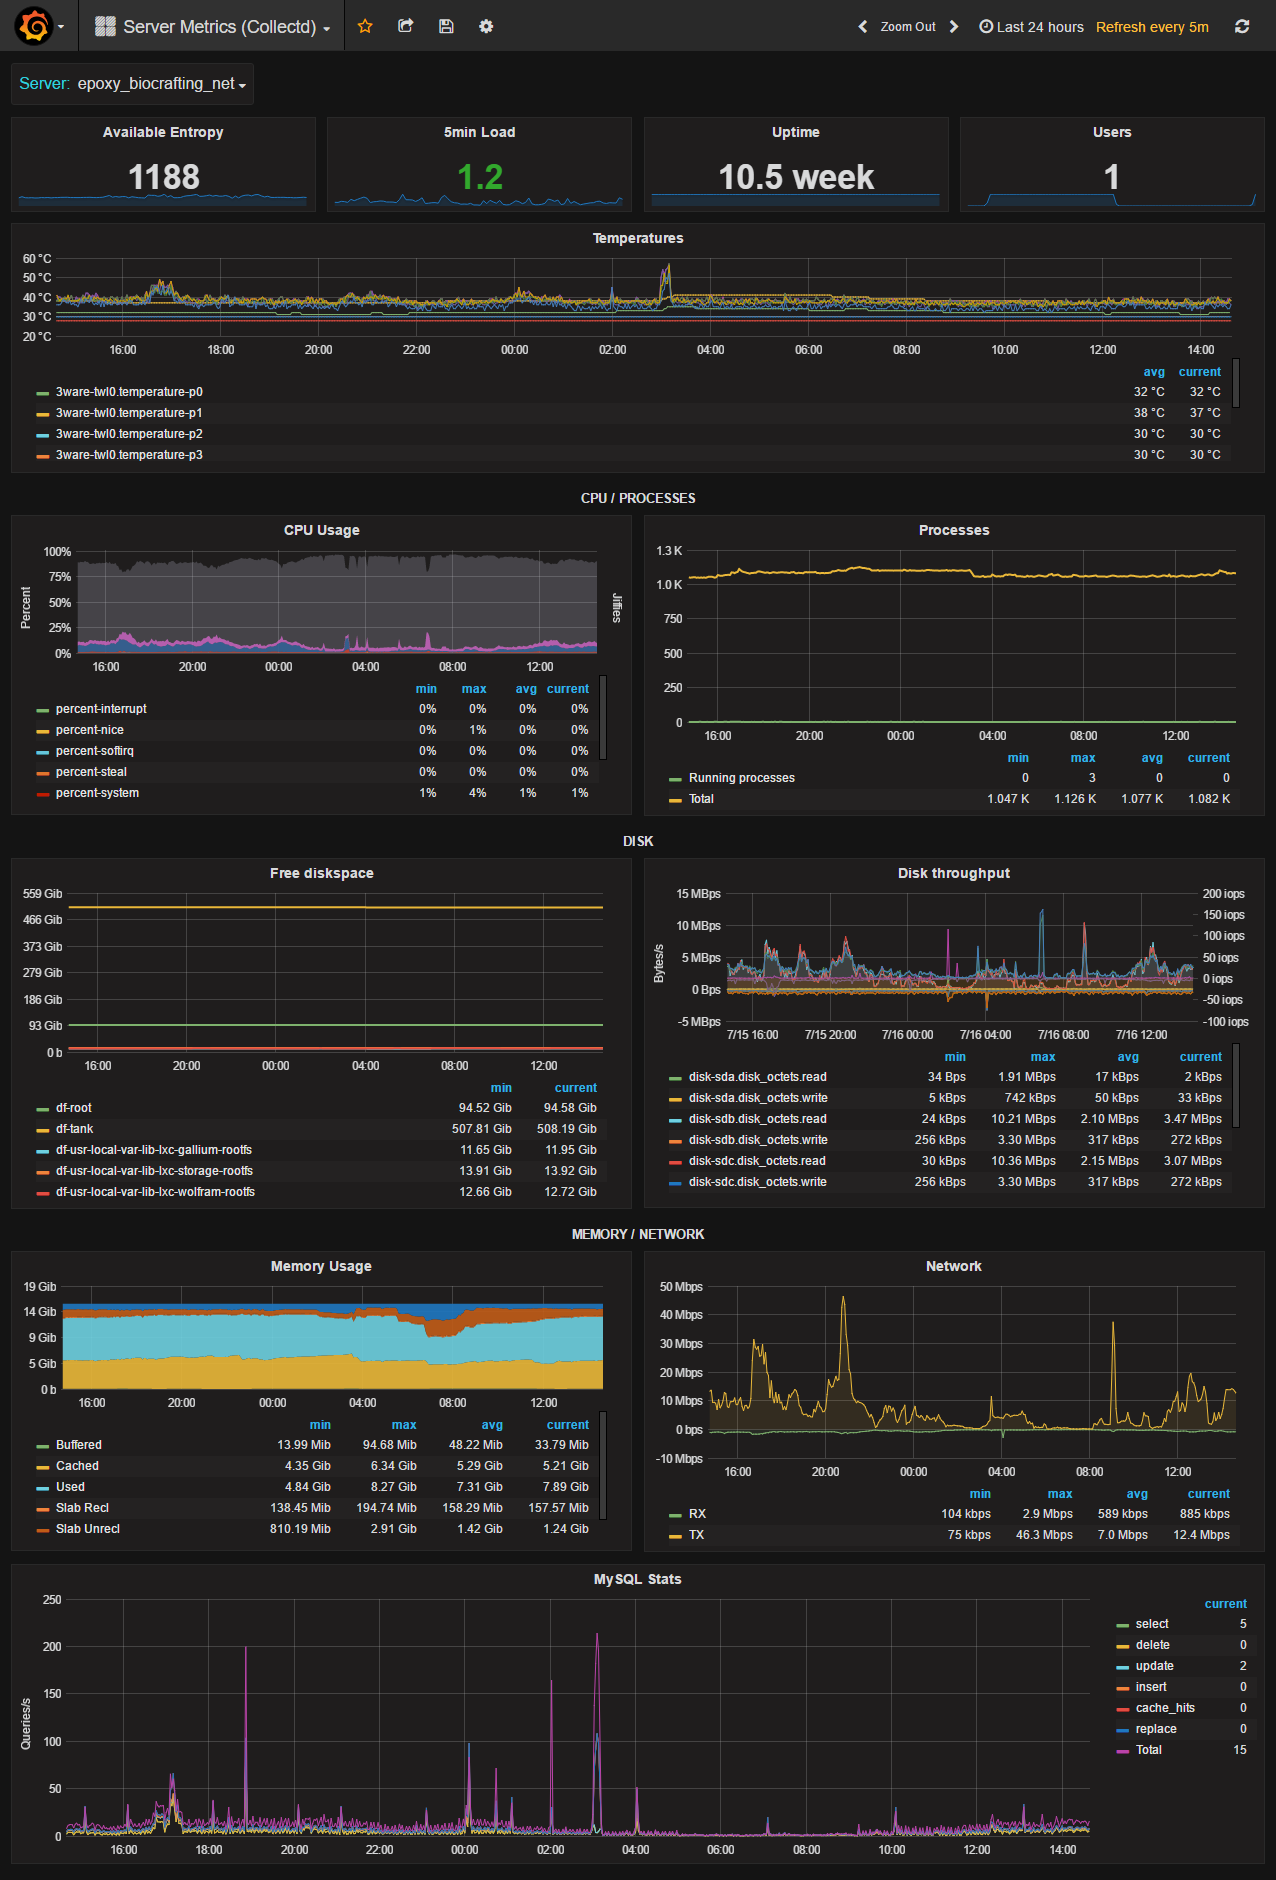
This is our server metrics dashboard based on data from collectd, which is feeded to a graphite server.
Dashboard metrics
- available entropy
- 5min load
- Uptime
- Users
- Temperatures
- CPU usage
- Processes
- Disk usage
- Disk throughput (MBps + IOPS)
- Memory Usage
- Network traffic
- MySQL Queries (Select, delete, update, insert, cache_hits, replace, total)
Sample collectd (Version 5.5.0) config: collectd.conf
This config use a custom exec script to gather the temperatures from a 3ware raid controller.
Metric Prefix
This dashboard expects the prefix collectd.
Data source config
Collector type:
Collector plugins:
Collector config:
Revisions
Upload an updated version of an exported dashboard.json file from Grafana
| Revision | Description | Created | |
|---|---|---|---|
| Download |
Get this dashboard
Resources