Telegraf system dashboard
A better dashboard for Telegraf and InfluxDB v1
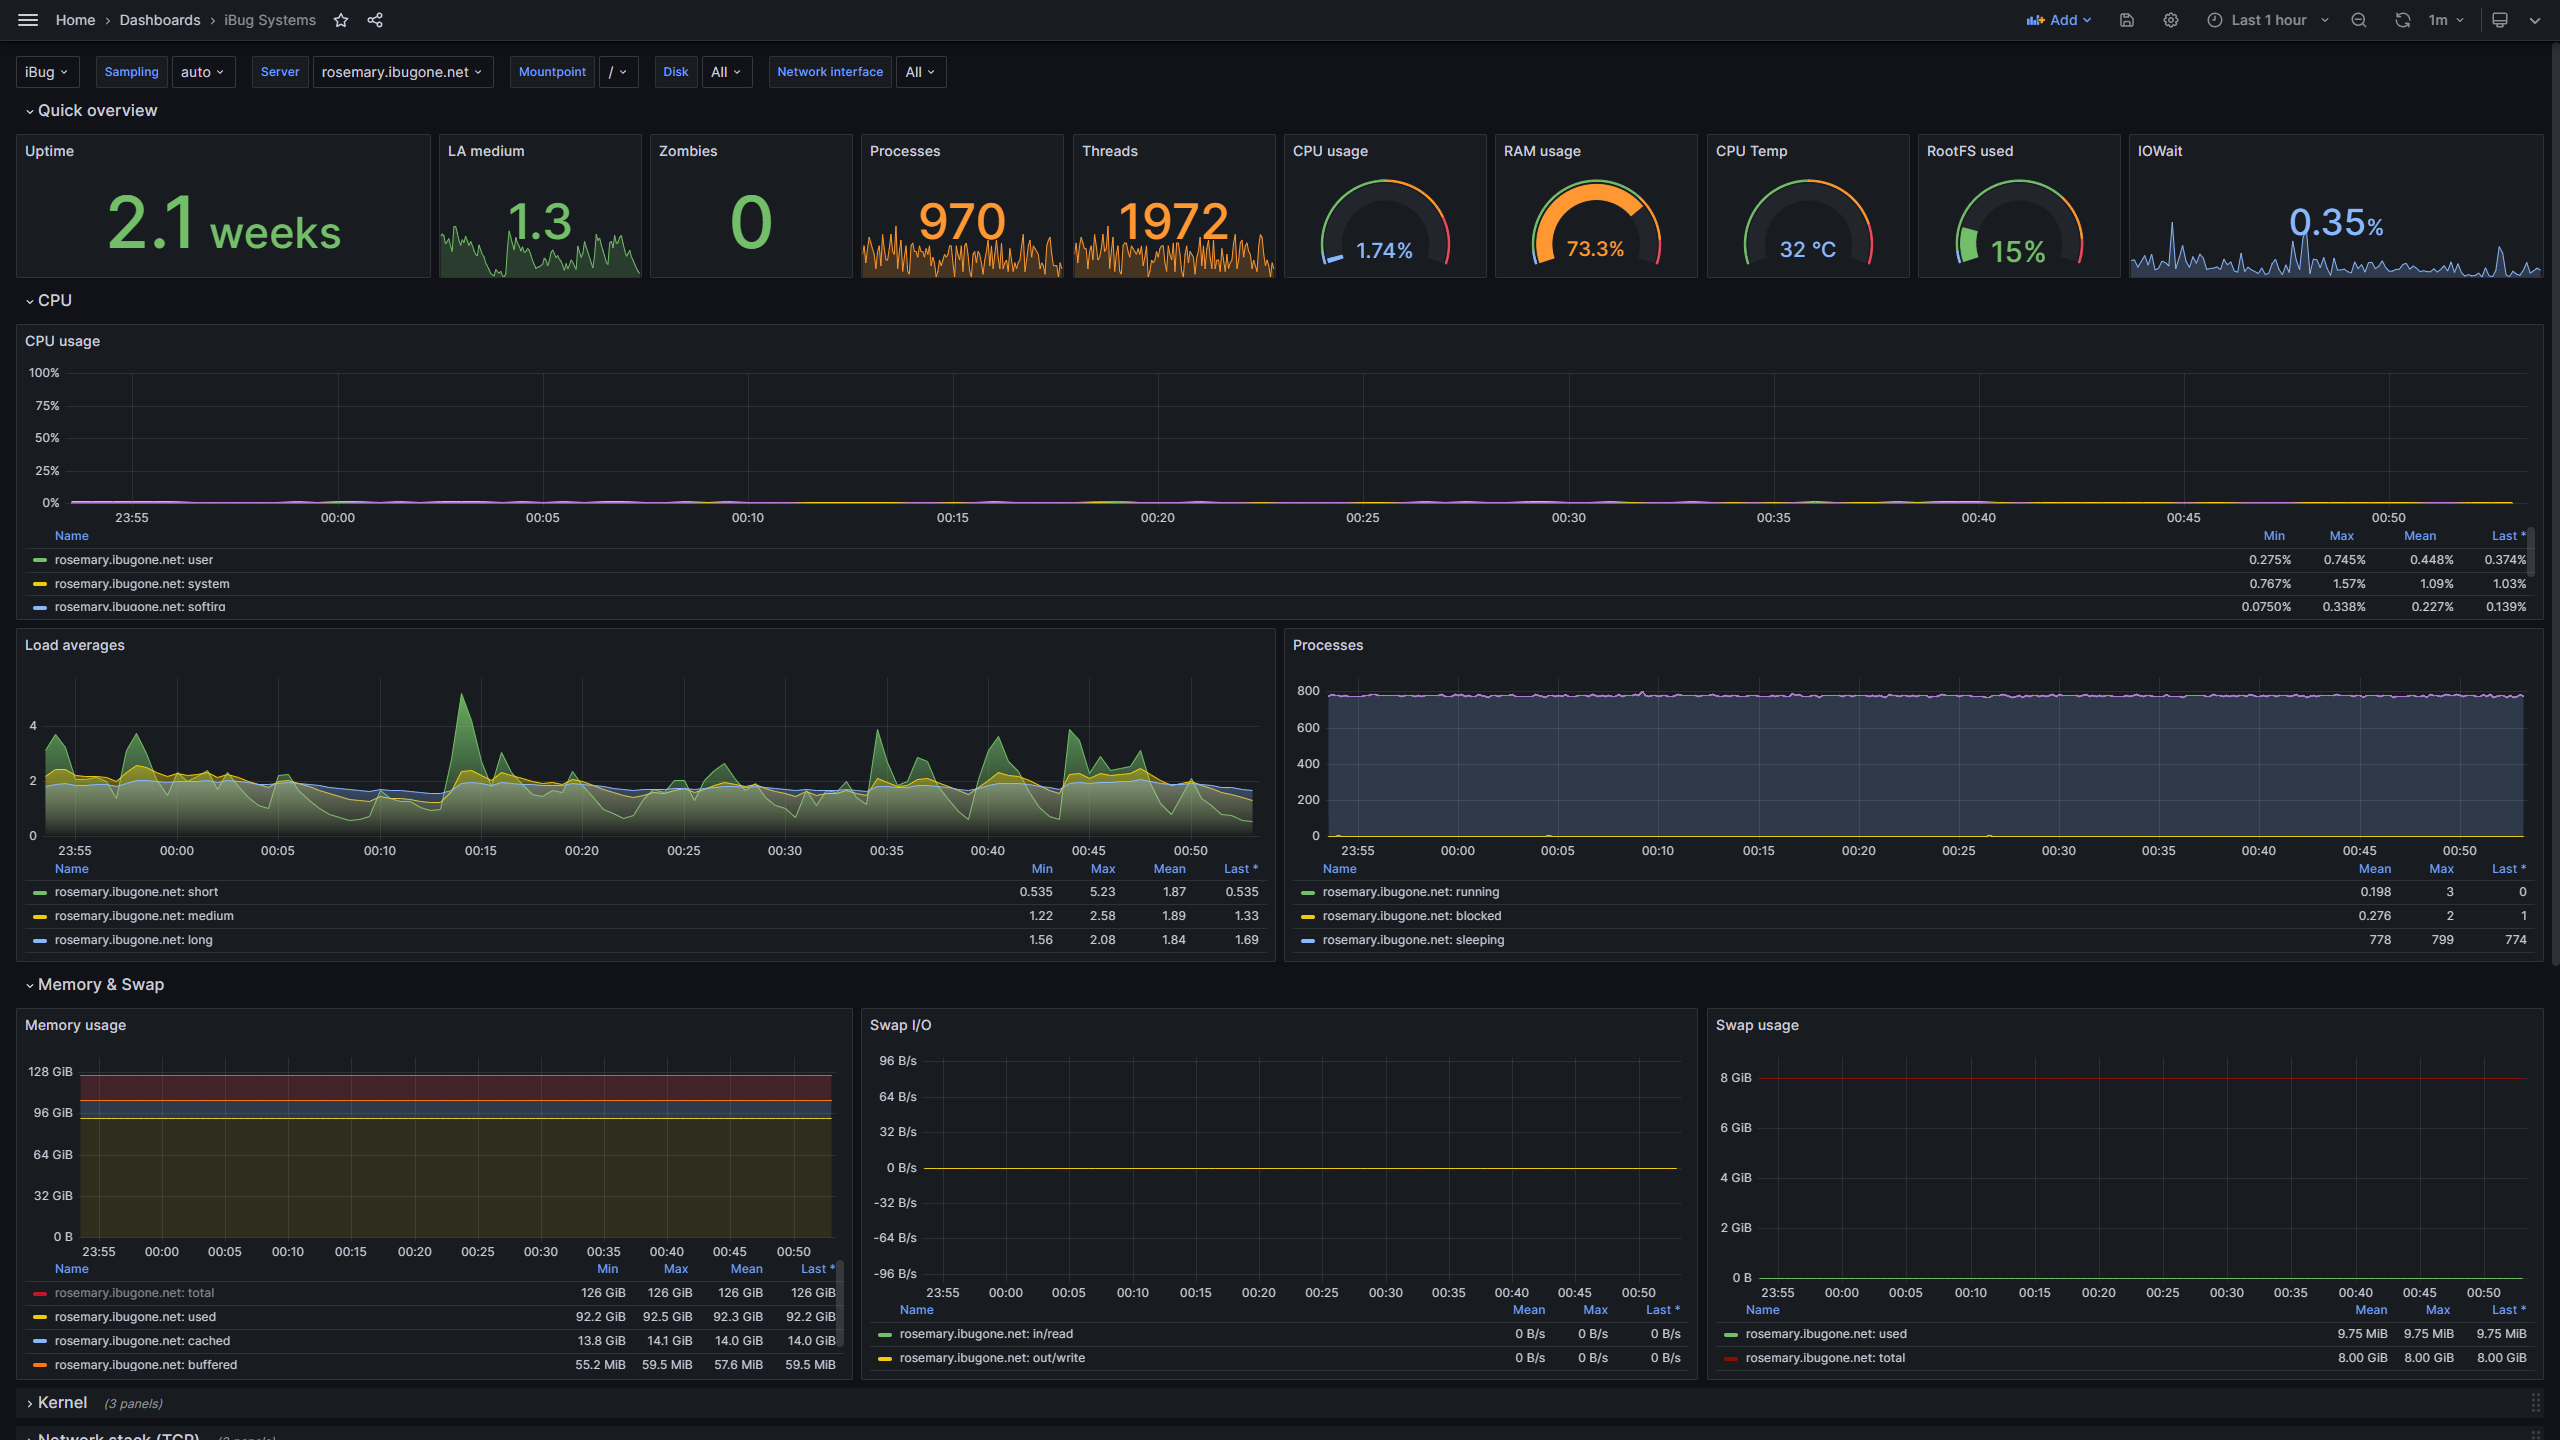
An updated version of 928 - Telegraf: system dashboard, with the same templating and repeating rows, but refreshed for Grafana v10.
All queries have been rewritten using Grafana's Query Editor, with similar queries grouped and all labeled, making it easy for those unfamiliar with InfluxQL to get started.
All panels in the "Quick overview" section have multiple thresholds configured, so that you can get a feel of your data by looking at their colors.
Data source config
Collector type:
Collector plugins:
Collector config:
Revisions
Upload an updated version of an exported dashboard.json file from Grafana
| Revision | Description | Created | |
|---|---|---|---|
| Download |