Synology Dashboard - Telegraf SNMP - InfluxDB
Grafana Dashboard for Synology Devices, collecting SNMP using Telegraf, and InfluxDB
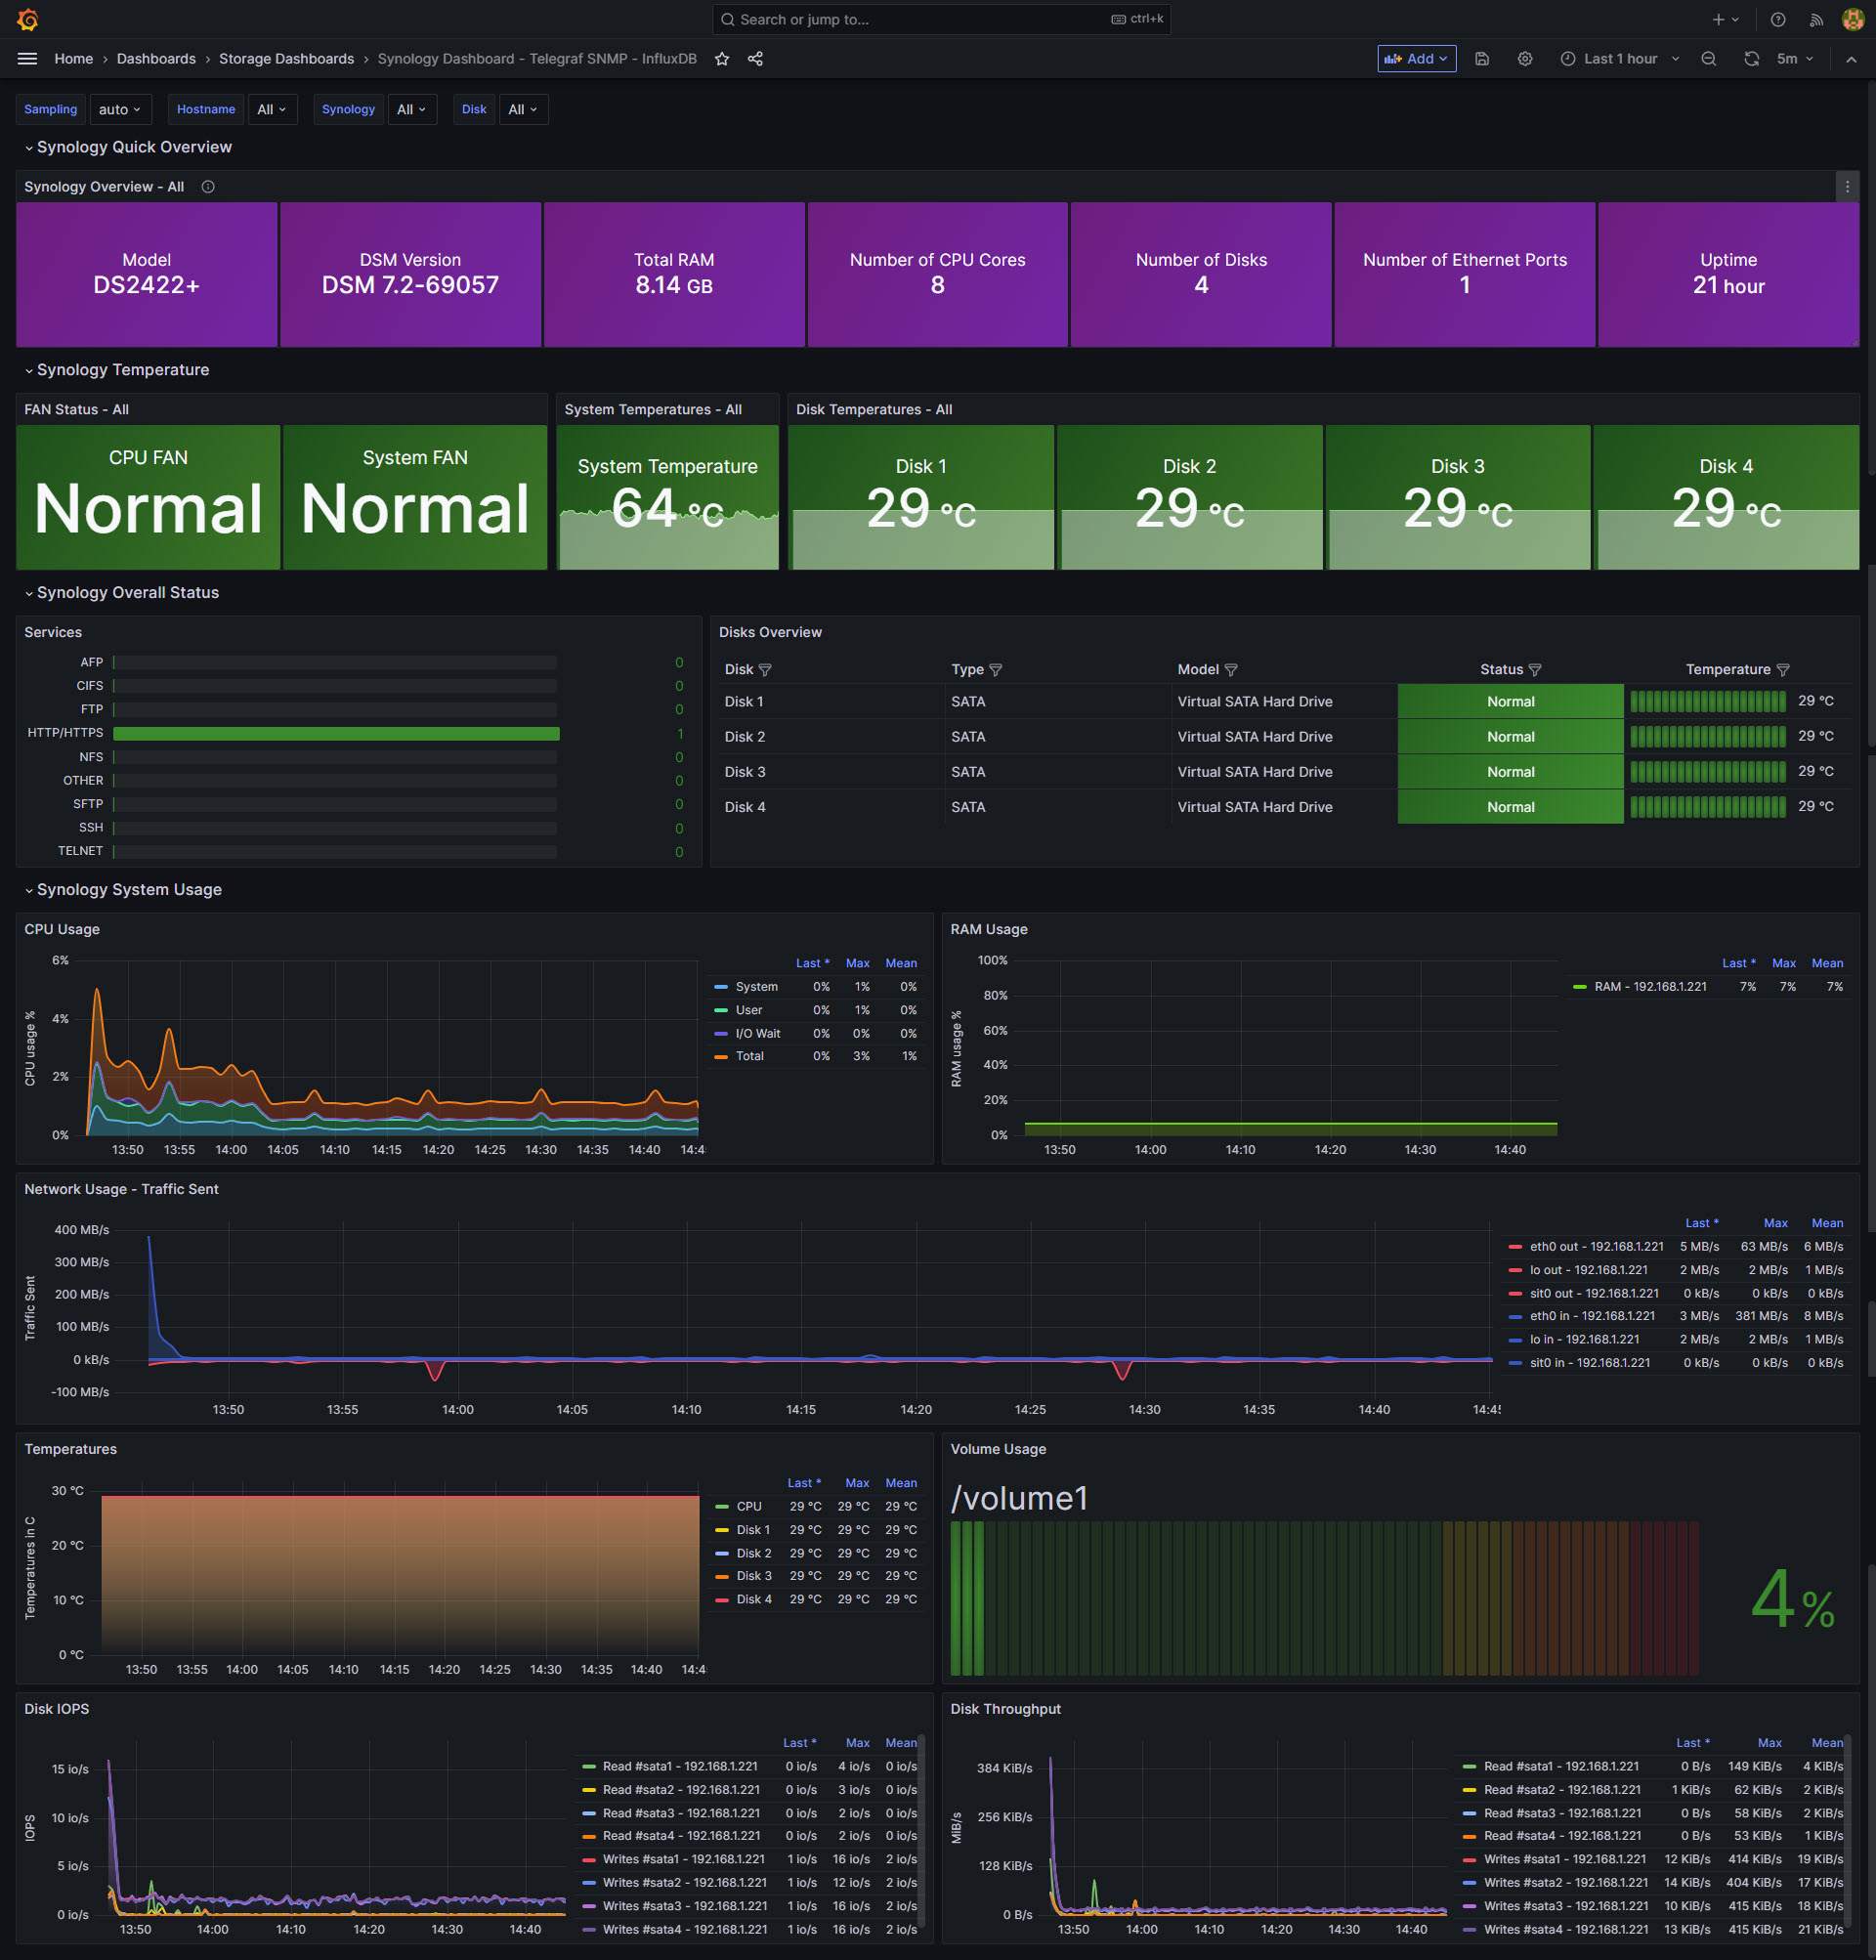
Synology Dashboard using SNMP v3. To collect data, I've used the always helpful telegraf SNMP plugin https://github.com/influxdata/telegraf/blob/master/plugins/inputs/snmp/README.md use the collector instructions from above ^
I've added all the variables to the Dashboard. The Grafana dashboard it should work out of the box.
It will work with SNMP v1/v2 as well, but I totally do not recommend it, stay safe and secure.
Data source config
Collector type:
Collector plugins:
Collector config:
Revisions
Upload an updated version of an exported dashboard.json file from Grafana
| Revision | Description | Created | |
|---|---|---|---|
| Download |
InfluxDB
Easily monitor InfluxDB, an open source time series database, with Grafana Cloud's out-of-the-box monitoring solution.
Learn more