Home Energy Power Consumption Monitoring
Experience unparalleled insights into your home energy consumption with the 'Home Energy Consumption Dashboard,' offering real-time data from Shelly 3PM through its RESTAPI interface. Powered by InDriver from www.inanalytics.io, this dashboard seamlessly handles data acquisition, aggregation, interpolation, and forecasting. Explore current power parameters, currents, voltages, average and max values, histograms, and detailed consumption breakdowns per day, month, and year, including end-of-day, month, and year forecasts. This user-friendly dashboard is effortlessly implementable for homes, businesses, or factories, providing comprehensive analytics for informed decision-making.
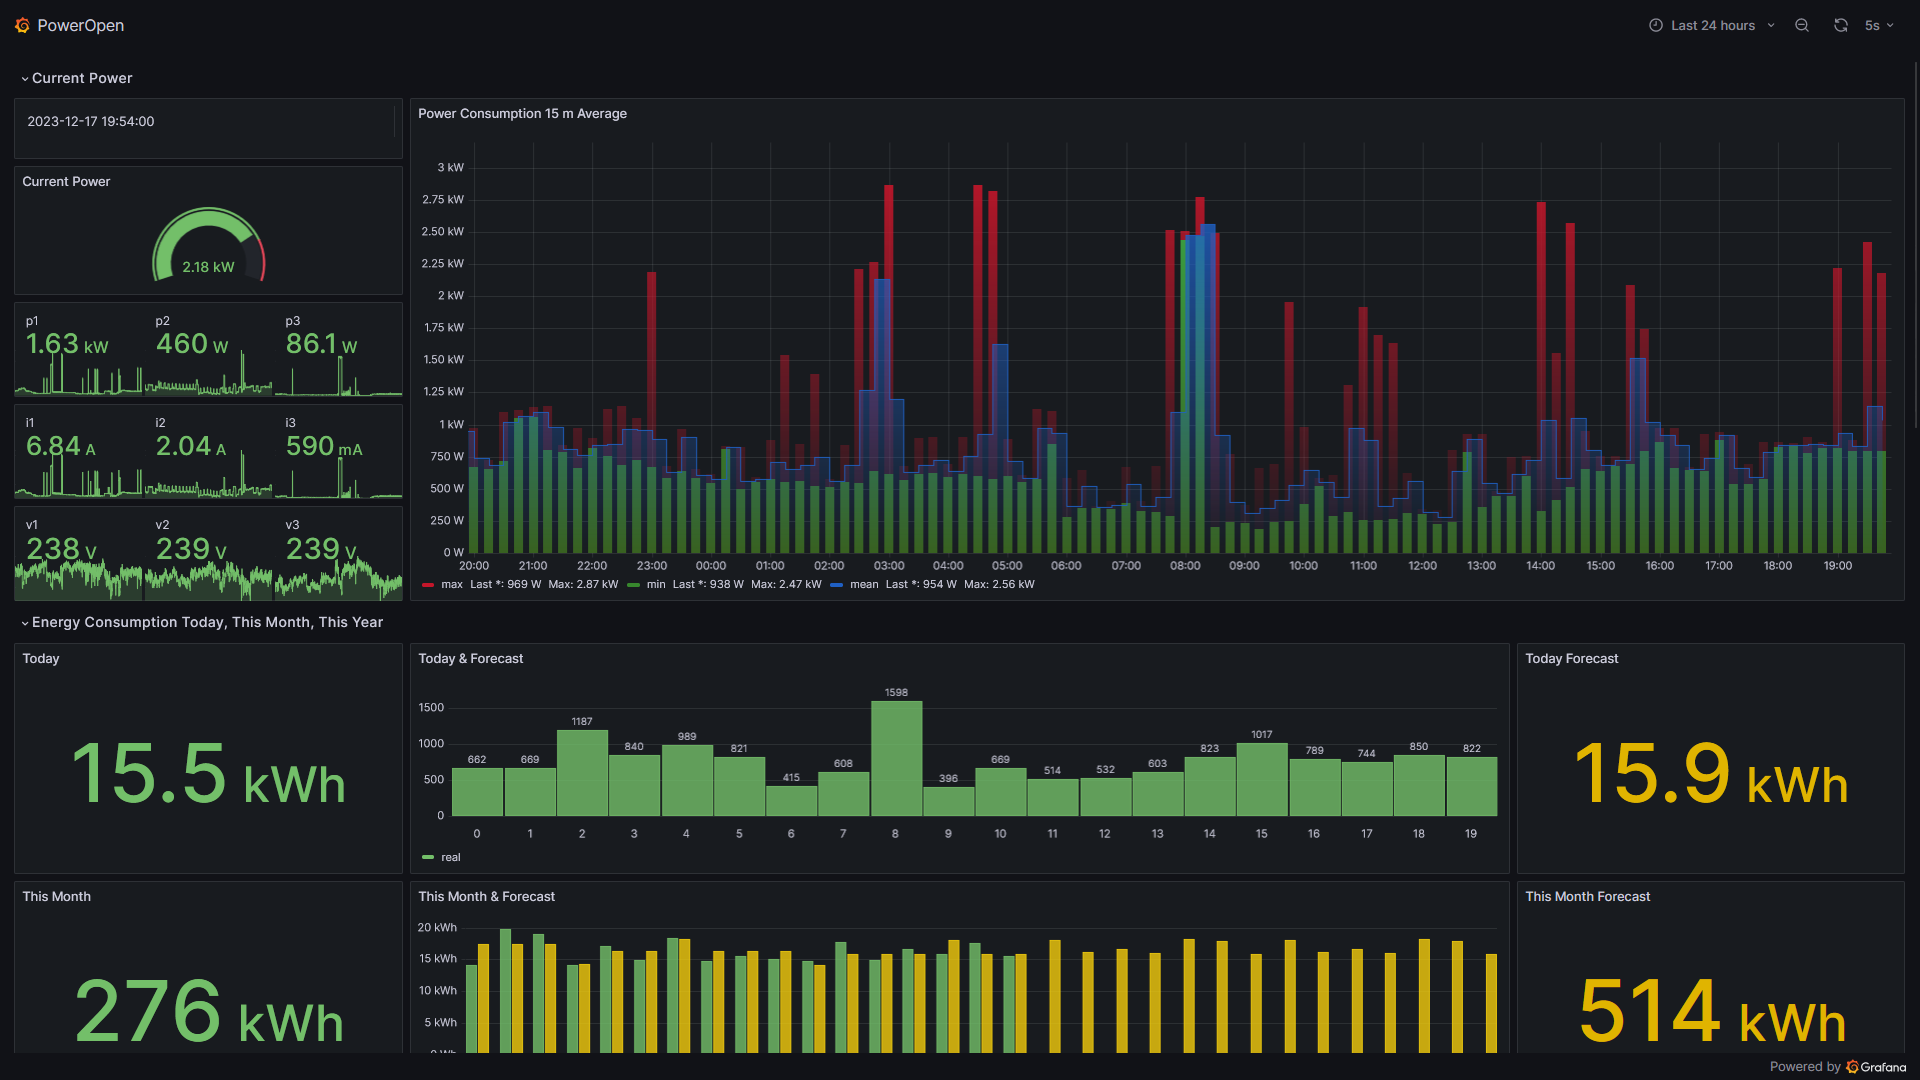
The dashboard offers a comprehensive view of real-time home electrical power supply, featuring key metrics like current power, 24-hour 15-minute average and max values, real-time current, power, and voltage indicators. It includes detailed energy consumption breakdowns for today per hour, this month per day, and this year per month, complete with estimated forecasts. Overcurrent and overvoltage protection histograms reveal the distribution of average and max values, while a breakdown of power for three phases provides additional insights. These indicators are invaluable for monitoring and forecasting Home Energy Consumption, complete with alerts and predictions. Stay tuned for the upcoming addition of cost forecasts.
Data are collected, aggregated, and processed with InDriver from www.inanalytics.io, a free software available for download. The system utilizes an Azure PostgreSQL database and an Azure Virtual Machine where InDriver runs. Visualization is done, of course, on Grafana.
Data source config
Collector config:
Upload an updated version of an exported dashboard.json file from Grafana
| Revision | Description | Created | |
|---|---|---|---|
| Download |
Home Assistant
Easily monitor Home Assistant, an open source software platform designed for home automation, with Grafana Cloud's out-of-the-box monitoring solution.
Learn more