
Telegraf InfluxDB Server stats
All the info you need of your Linux server using Telegraf, InfluxDB and of course Grafana!
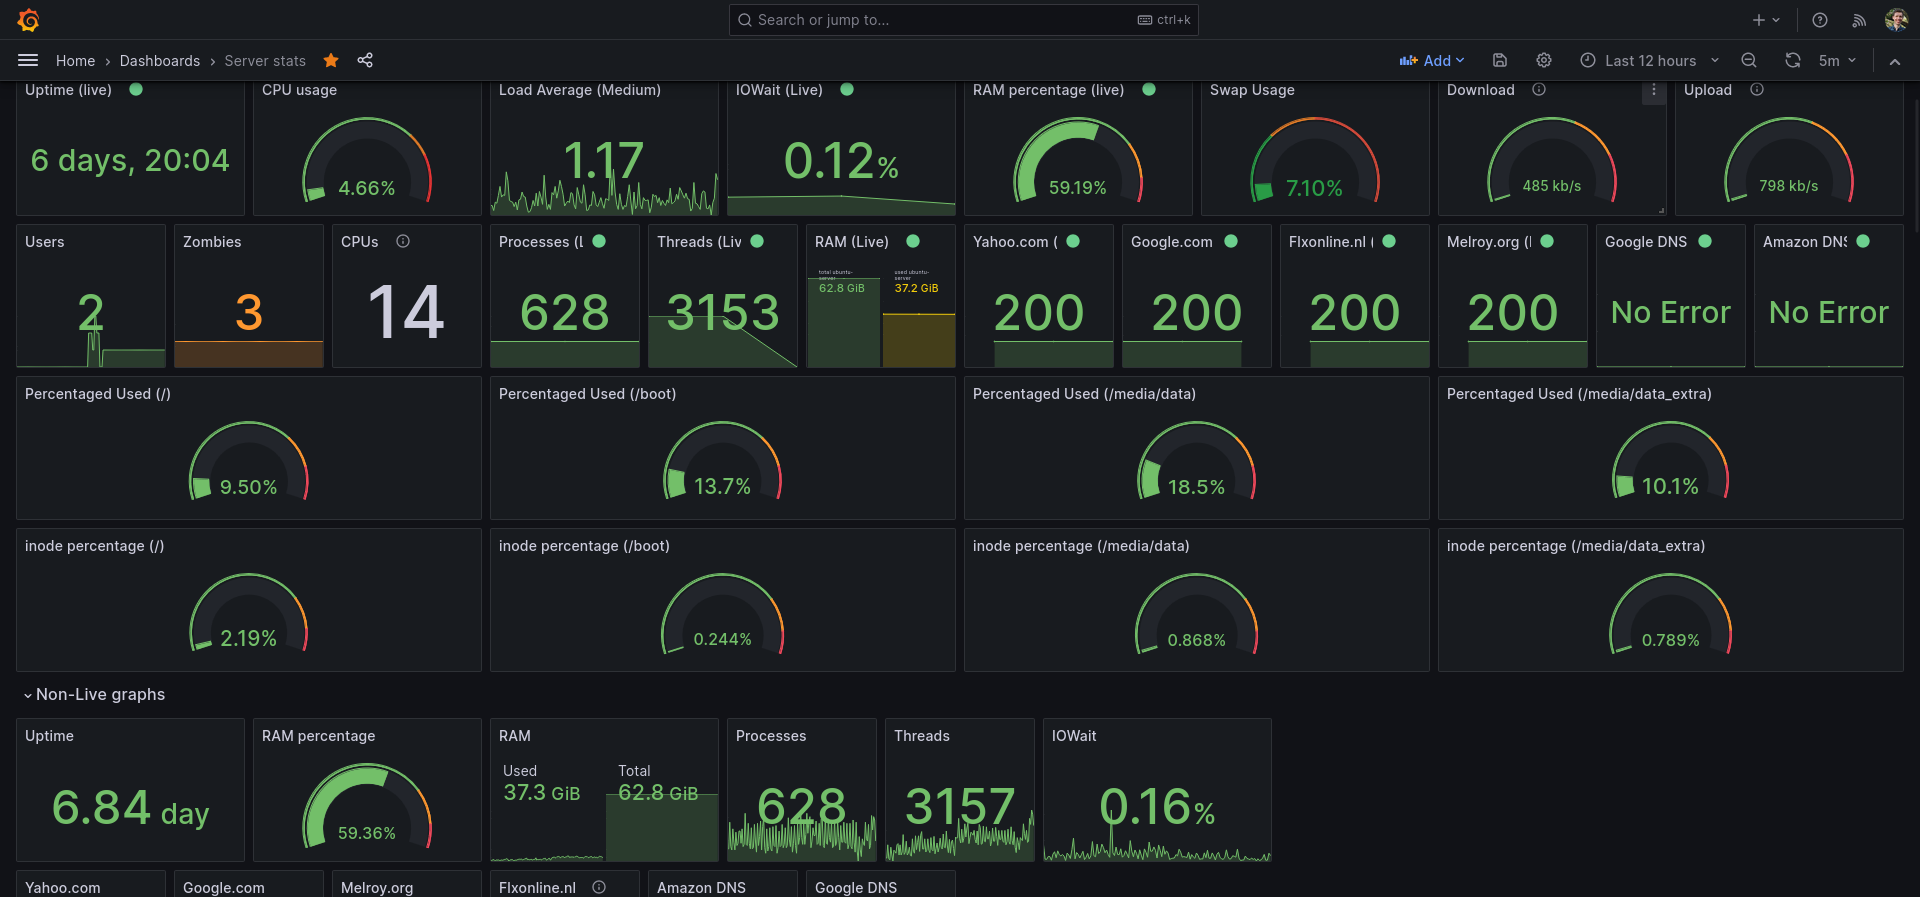
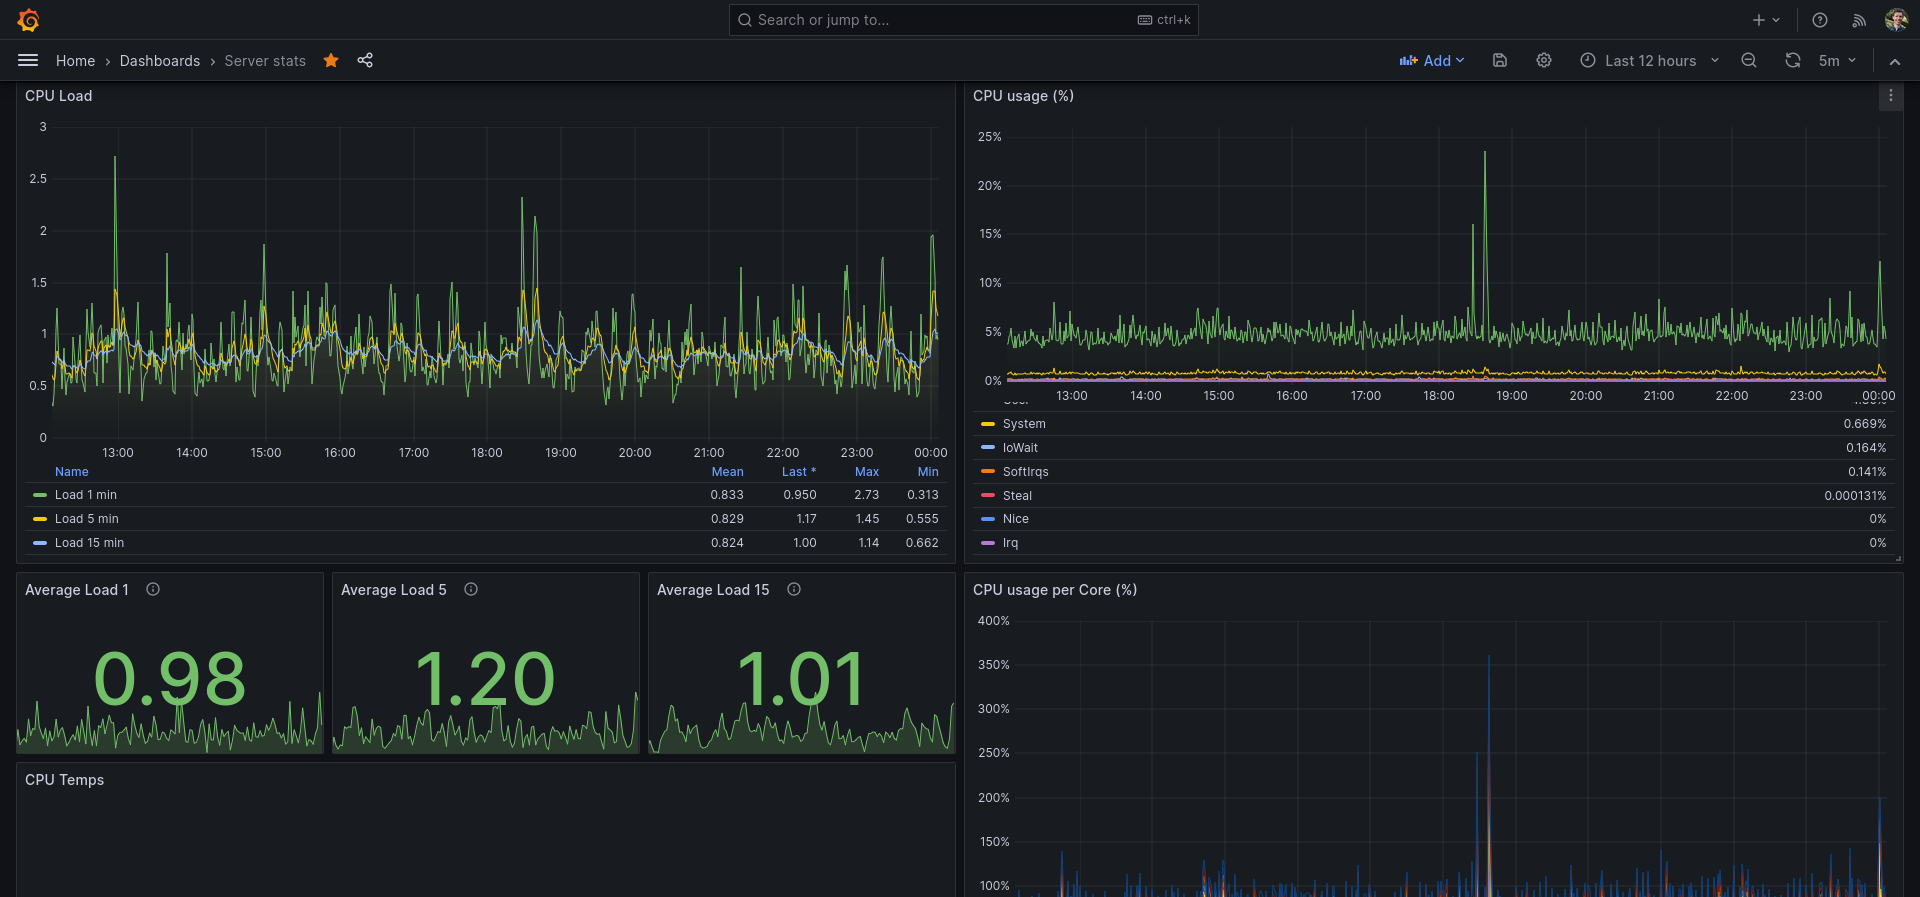
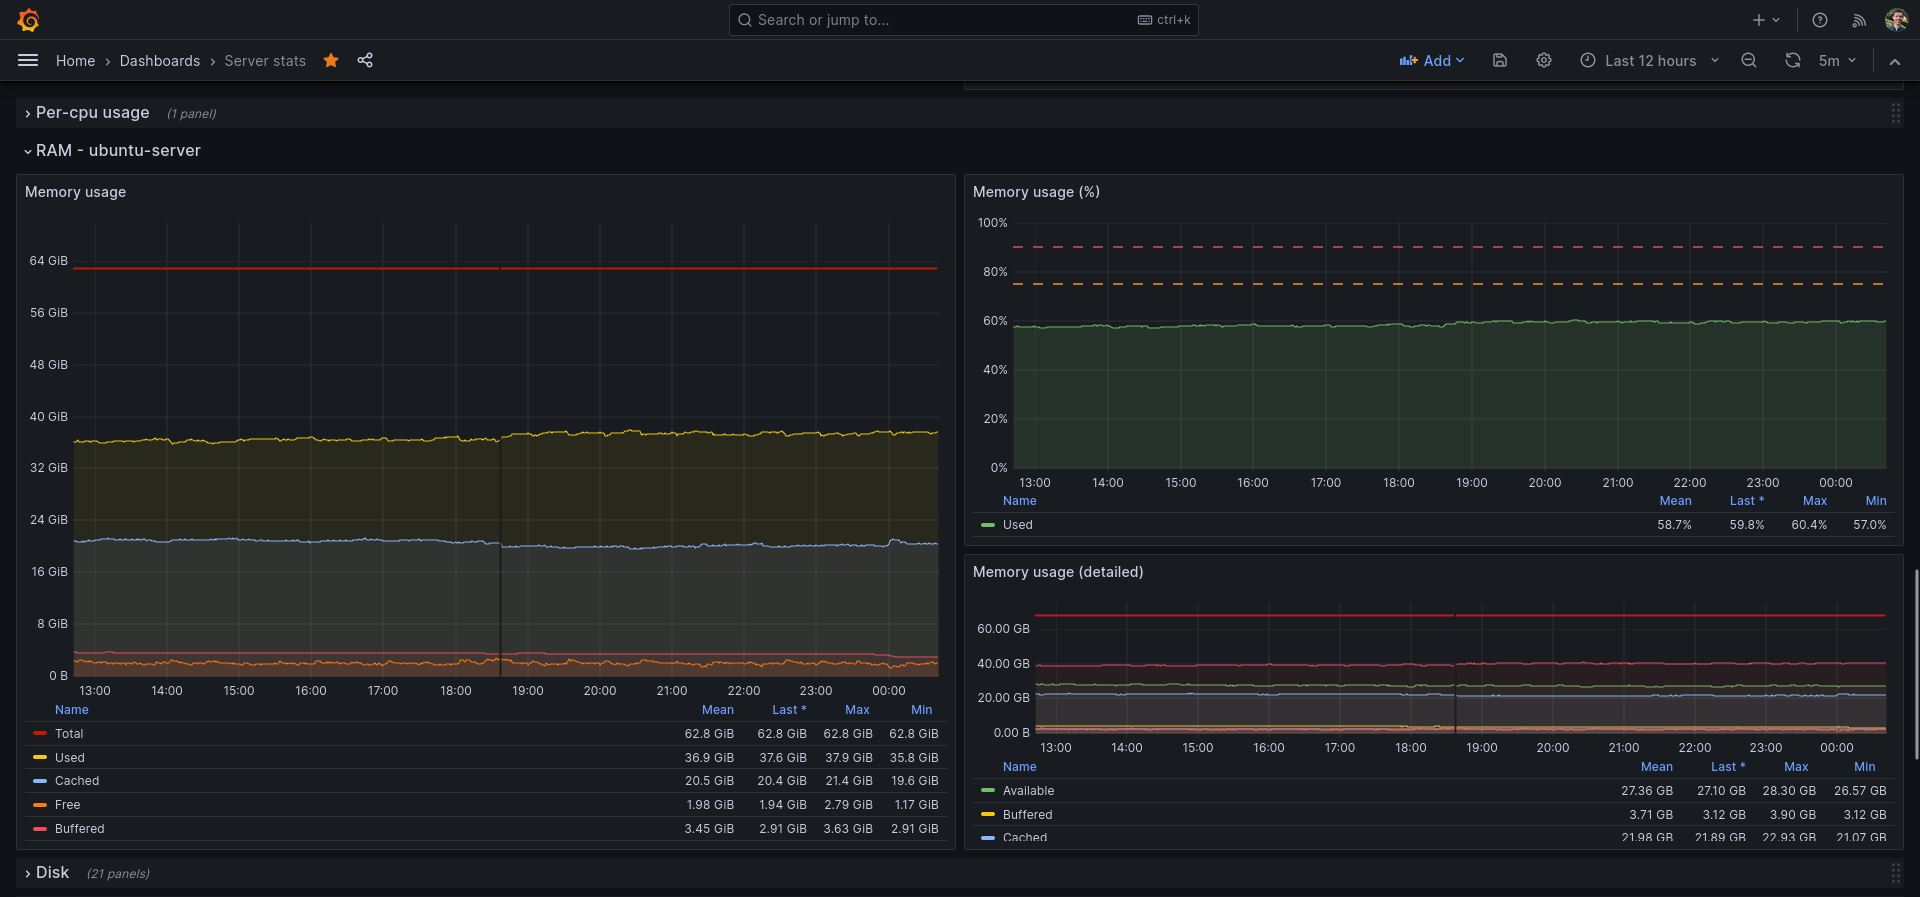
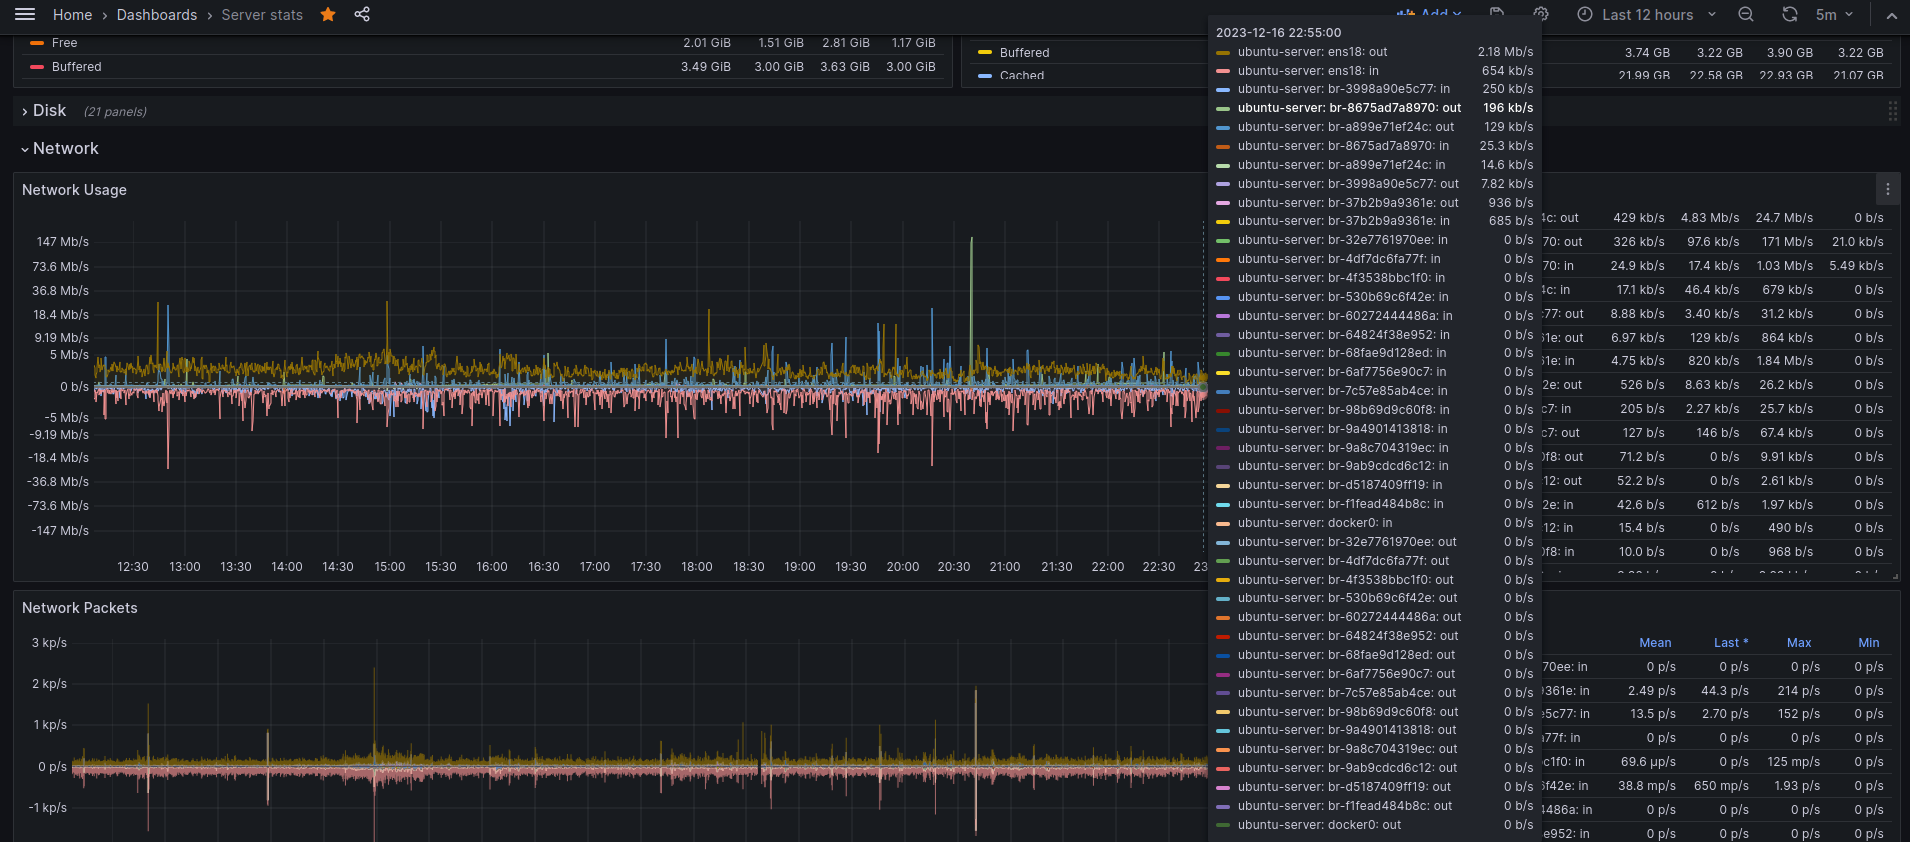
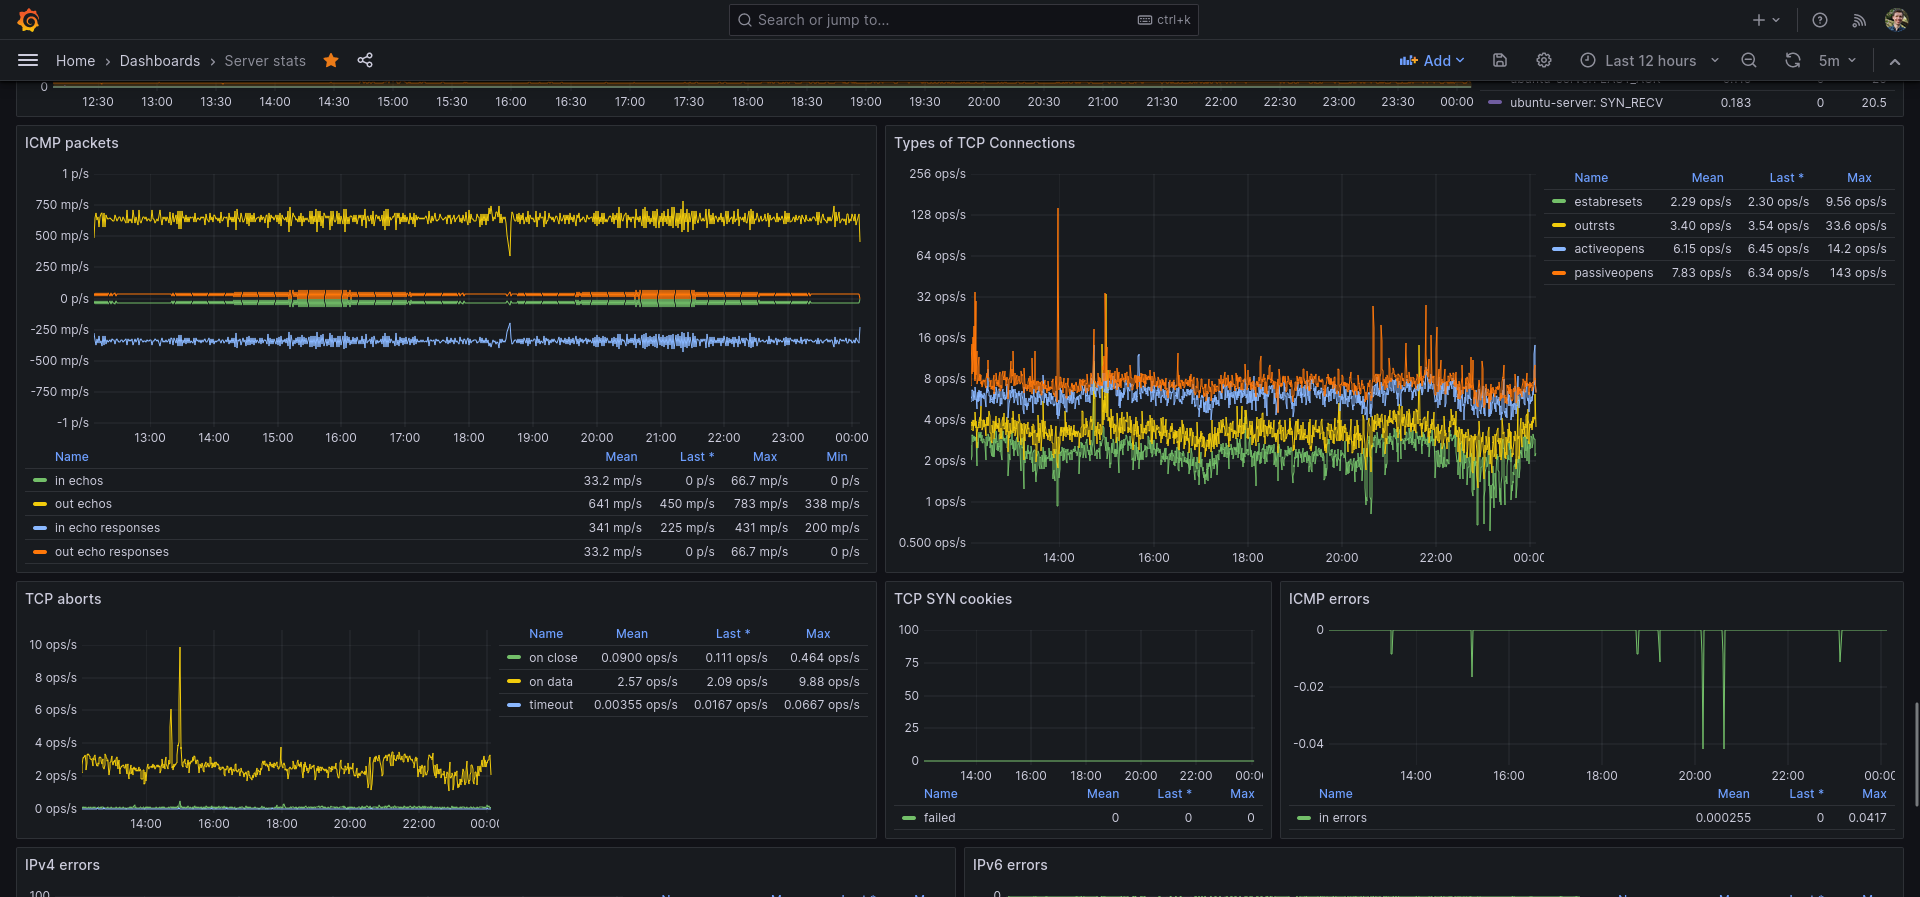
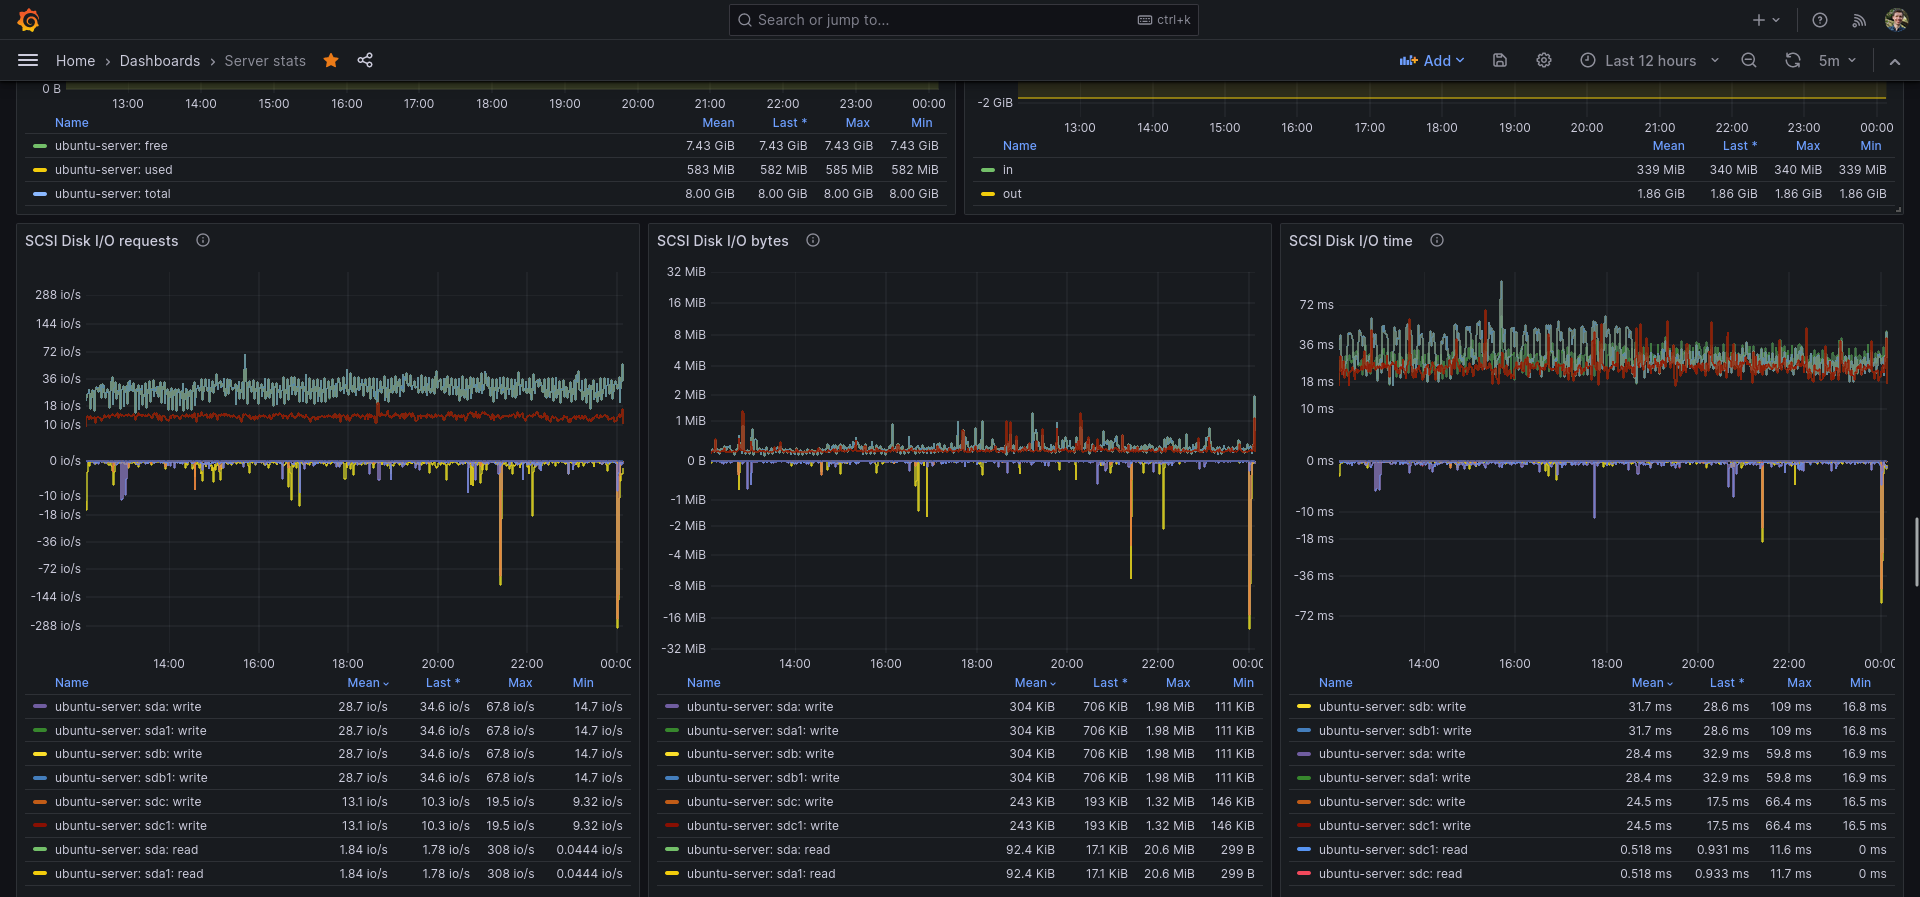
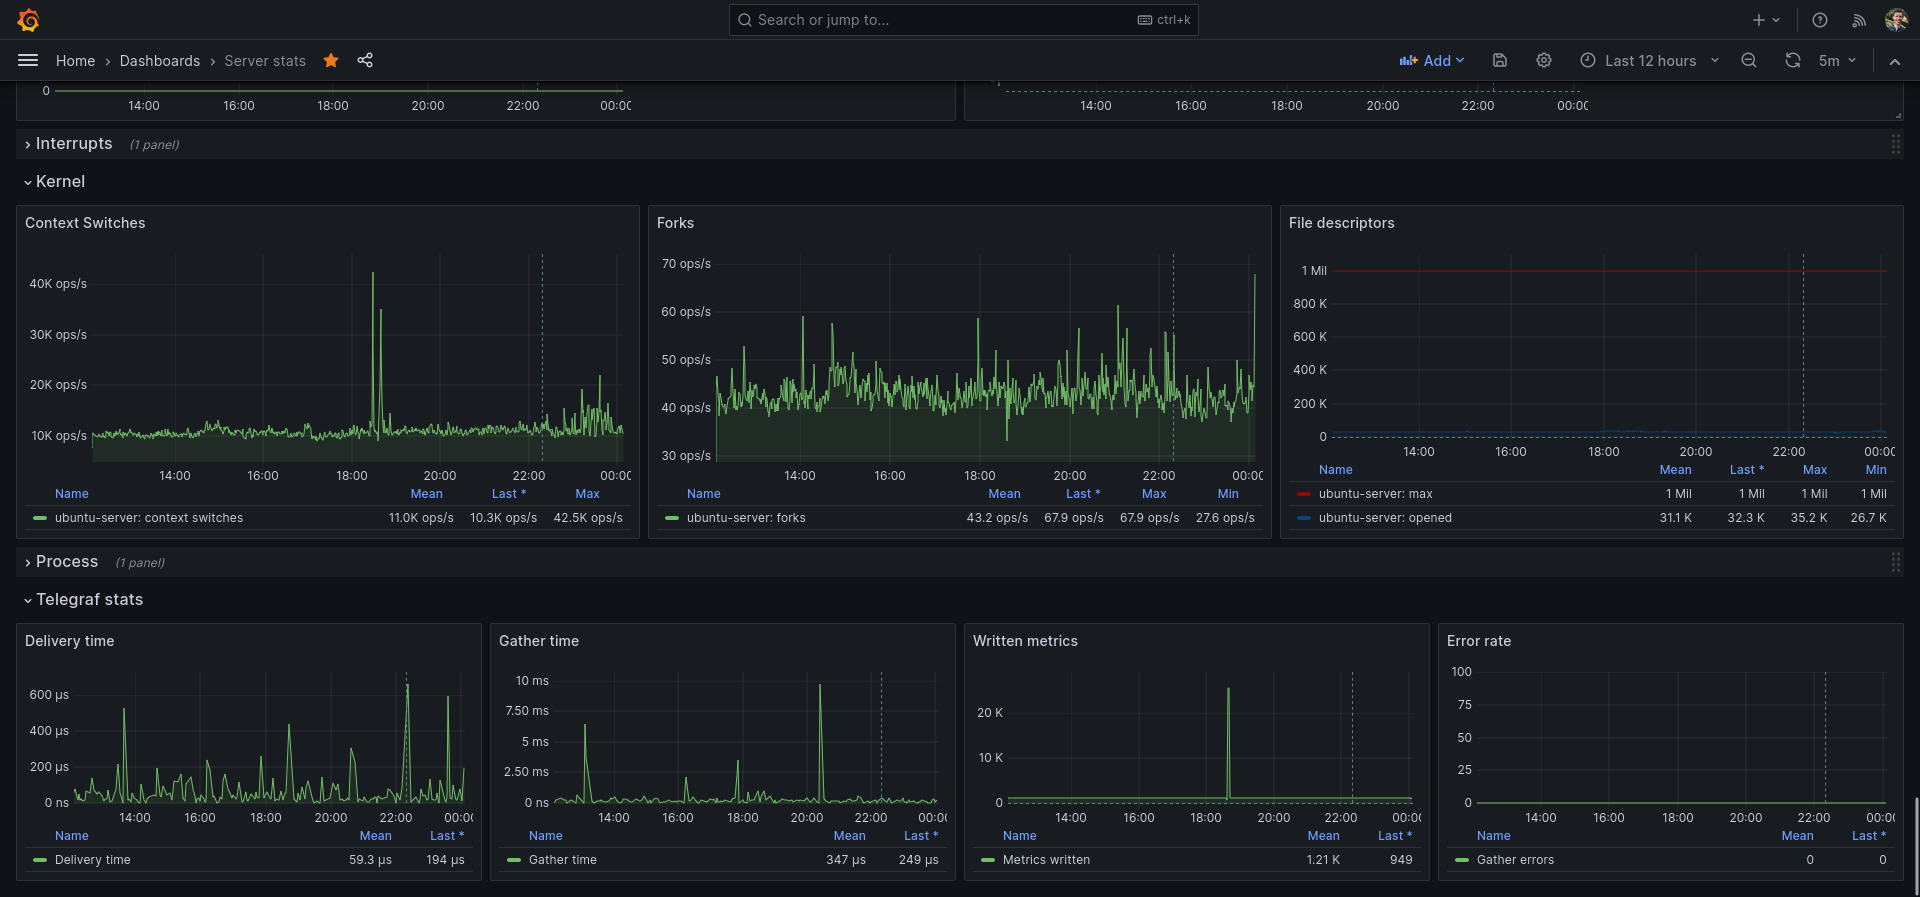
I use this dashboard as my main Grafana dashboard for monitoring my server and Linux machine. You do need Telegraf & InfluxDB.
I recently also try to use Grafana Live in some places, which shows real-time data (Grafana Live is WIP for me, but also for Grafana itself).
My /etc/telegraf/telegraf.conf file:
# Configuration for telegraf agent
[agent]
## Default data collection interval for all inputs
interval = "10s"
## Rounds collection interval to 'interval'
## ie, if interval="10s" then always collect on :00, :10, :20, etc.
round_interval = true
Telegraf will send metrics to outputs in batches of at most
metric_batch_size metrics.
This controls the size of writes that Telegraf sends to output plugins.
metric_batch_size = 1000
Maximum number of unwritten metrics per output. Increasing this value
allows for longer periods of output downtime without dropping metrics at the
cost of higher maximum memory usage.
metric_buffer_limit = 10000
Collection jitter is used to jitter the collection by a random amount.
Each plugin will sleep for a random time within jitter before collecting.
This can be used to avoid many plugins querying things like sysfs at the
same time, which can have a measurable effect on the system.
collection_jitter = "2s"
Collection offset is used to shift the collection by the given amount.
This can be be used to avoid many plugins querying constraint devices
at the same time by manually scheduling them in time.
collection_offset = "0s"
Default flushing interval for all outputs. Maximum flush_interval will be
flush_interval + flush_jitter
flush_interval = "10s"
Jitter the flush interval by a random amount. This is primarily to avoid
large write spikes for users running a large number of telegraf instances.
ie, a jitter of 5s and interval 10s means flushes will happen every 10-15s
flush_jitter = "2s"
Collected metrics are rounded to the precision specified. Precision is
specified as an interval with an integer + unit (e.g. 0s, 10ms, 2us, 4s).
Valid time units are "ns", "us" (or "µs"), "ms", "s".
By default or when set to "0s", precision will be set to the same
timestamp order as the collection interval, with the maximum being 1s:
ie, when interval = "10s", precision will be "1s"
when interval = "250ms", precision will be "1ms"
Precision will NOT be used for service inputs. It is up to each individual
service input to set the timestamp at the appropriate precision.
precision = "0s"
Override default hostname, if empty use os.Hostname()
hostname = ""
If set to true, do no set the "host" tag in the telegraf agent.
omit_hostname = false
###############################################################################
OUTPUT PLUGINS
###############################################################################
# Configuration for sending metrics to InfluxDB
[[outputs.influxdb]]
## The full HTTP or UDP URL for your InfluxDB instance.
## Multiple URLs can be specified for a single cluster, only ONE of the
## urls will be written to each interval.
# urls = ["unix:///var/run/influxdb.sock"]
# urls = ["udp://127.0.0.1:8089"]
urls = ["unix:///var/run/influxdb/influxdb.sock"]
# A plugin that can transmit metrics over WebSocket.
[[outputs.websocket]]
flush_interval = "500ms"
url = "ws://localhost:3002/api/live/push/telegraf"
data_format = "influx"
[outputs.websocket.headers]
Authorization = "Bearer secret-token"
###############################################################################
INPUT PLUGINS
###############################################################################
Read metrics about cpu usage
[[inputs.cpu]]
Whether to report per-cpu stats or not
percpu = true
Whether to report total system cpu stats or not
totalcpu = true
If true, collect raw CPU time metrics
collect_cpu_time = false
If true, compute and report the sum of all non-idle CPU states
NOTE: The resulting 'time_active' field INCLUDES 'iowait'!
report_active = false
If true and the info is available then add core_id and physical_id tags
core_tags = false
Read metrics about disk usage by mount point
[[inputs.disk]]
By default stats will be gathered for all mount points.
Set mount_points will restrict the stats to only the specified mount points.
mount_points = ["/"]
Ignore mount points by filesystem type.
ignore_fs = ["tmpfs", "devtmpfs", "devfs", "iso9660", "overlay", "aufs", "squashfs"]
Ignore mount points by mount options.
The 'mount' command reports options of all mounts in parathesis.
Bind mounts can be ignored with the special 'bind' option.
ignore_mount_opts = []
Read metrics about disk IO by device
[[inputs.diskio]]
By default, telegraf will gather stats for all devices including
disk partitions.
Plugin to collect various Linux kernel statistics.
This plugin ONLY supports Linux
[[inputs.kernel]]
Additional gather options
Possible options include:
* ksm - kernel same-page merging
collect = []
Read metrics about memory usage
[[inputs.mem]]
no configuration
Get the number of processes and group them by status
This plugin ONLY supports non-Windows
[[inputs.processes]]
Use sudo to run ps command on *BSD systems. Linux systems will read
/proc, so this does not apply there.
use_sudo = false
Read metrics about swap memory usage
This plugin ONLY supports Linux
[[inputs.swap]]
no configuration
Read metrics about system load & uptime
[[inputs.system]]
no configuration
# Query given DNS server and gives statistics
[[inputs.dns_query]]
## servers to query
servers = ["8.8.8.8", "1.1.1.1"]
# Read metrics about docker containers
[[inputs.docker]]
## Docker Endpoint
## To use TCP, set endpoint = "tcp://[ip]:[port]"
## To use environment variables (ie, docker-machine), set endpoint = "ENV"
endpoint = "unix:///var/run/docker.sock"
# HTTP/HTTPS request given an address a method and a timeout
[[inputs.http_response]]
## List of urls to query.
urls = ["https://google.com", "https://yahoo.com"]
## Set http_proxy.
## Telegraf uses the system wide proxy settings if it's is not set.
# http_proxy = "http://localhost:8888"
## Set response_timeout (default 5 seconds)
# response_timeout = "5s"
## HTTP Request Method
# method = "GET"
## Whether to follow redirects from the server (defaults to false)
follow_redirects = true
# Collect statistics about itself
[[inputs.internal]]
## If true, collect telegraf memory stats.
# collect_memstats = true
## If true, collect metrics from Go's runtime.metrics. For a full list see:
## https://pkg.go.dev/runtime/metrics
# collect_gostats = false
# This plugin gathers interrupts data from /proc/interrupts and /proc/softirqs.
[[inputs.interrupts]]
## When set to true, cpu metrics are tagged with the cpu. Otherwise cpu is
## stored as a field.
## The default is false for backwards compatibility, and will be changed to
## true in a future version. It is recommended to set to true on new
## deployments.
# cpu_as_tag = false
## To filter which IRQs to collect, make use of tagpass / tagdrop, i.e.
# [inputs.interrupts.tagdrop]
# irq = [ "NET_RX", "TASKLET" ]
# Get kernel statistics from /proc/vmstat
# This plugin ONLY supports Linux
[[inputs.kernel_vmstat]]
# no configuration
# Provides Linux sysctl fs metrics
[[inputs.linux_sysctl_fs]]
# no configuration
# Get kernel statistics from /proc/mdstat
# This plugin ONLY supports Linux
[[inputs.mdstat]]
## Sets file path
## If not specified, then default is /proc/mdstat
# file_name = "/proc/mdstat"
# Gather metrics about network interfaces
[[inputs.net]]
## By default, telegraf gathers stats from any up interface (excluding loopback)
## Setting interfaces will tell it to gather these explicit interfaces,
## regardless of status. When specifying an interface, glob-style
## patterns are also supported.
# interfaces = ["eth*", "enp0s[0-1]", "lo"]
## On linux systems telegraf also collects protocol stats.
## Setting ignore_protocol_stats to true will skip reporting of protocol metrics.
## DEPRECATION NOTICE: A value of 'false' is deprecated and discouraged!
## Please set this to true and use the 'inputs.nstat'
## plugin instead.
# ignore_protocol_stats = false
# Read TCP metrics such as established, time wait and sockets counts.
[[inputs.netstat]]
# no configuration
# Read Nginx's basic status information (ngx_http_stub_status_module)
[[inputs.nginx]]
## An array of Nginx stub_status URI to gather stats.
urls = ["https://localhost/server_status"]
## Optional TLS Config
# tls_ca = "/etc/telegraf/ca.pem"
# tls_cert = "/etc/telegraf/cert.pem"
# tls_key = "/etc/telegraf/key.pem"
## Use TLS but skip chain & host verification
# insecure_skip_verify = false
## HTTP response timeout (default: 5s)
response_timeout = "5s"
# Collect kernel snmp counters and network interface statistics
[[inputs.nstat]]
## file paths for proc files. If empty default paths will be used:
## /proc/net/netstat, /proc/net/snmp, /proc/net/snmp6
## These can also be overridden with env variables, see README.
proc_net_netstat = "/proc/net/netstat"
proc_net_snmp = "/proc/net/snmp"
proc_net_snmp6 = "/proc/net/snmp6"
## dump metrics with 0 values too
dump_zeros = true
# Ping given url(s) and return statistics
[[inputs.ping]]
## Hosts to send ping packets to.
urls = ["google.com", "yahoo.com", "1.1.1.1"]
## Method used for sending pings, can be either "exec" or "native". When set
## to "exec" the systems ping command will be executed. When set to "native"
## the plugin will send pings directly.
## While the default is "exec" for backwards compatibility, new deployments
## are encouraged to use the "native" method for improved compatibility and
## performance.
# method = "exec"
## Number of ping packets to send per interval. Corresponds to the "-c"
## option of the ping command.
# count = 1
## Time to wait between sending ping packets in seconds. Operates like the
## "-i" option of the ping command.
ping_interval = 5.0
## If set, the time to wait for a ping response in seconds. Operates like
## the "-W" option of the ping command.
# timeout = 1.0
## If set, the total ping deadline, in seconds. Operates like the -w option
## of the ping command.
# deadline = 10
## Interface or source address to send ping from. Operates like the -I or -S
## option of the ping command.
# interface = ""
## Percentiles to calculate. This only works with the native method.
# percentiles = [50, 95, 99]
## Specify the ping executable binary.
# binary = "ping"
## Arguments for ping command. When arguments is not empty, the command from
## the binary option will be used and other options (ping_interval, timeout,
## etc) will be ignored.
# arguments = ["-c", "3"]
## Use only IPv6 addresses when resolving a hostname.
# ipv6 = false
## Number of data bytes to be sent. Corresponds to the "-s"
## option of the ping command. This only works with the native method.
# size = 56
Data source config
Collector config:
Upload an updated version of an exported dashboard.json file from Grafana
| Revision | Description | Created | |
|---|---|---|---|
| Download |
InfluxDB
Easily monitor InfluxDB, an open source time series database, with Grafana Cloud's out-of-the-box monitoring solution.
Learn more