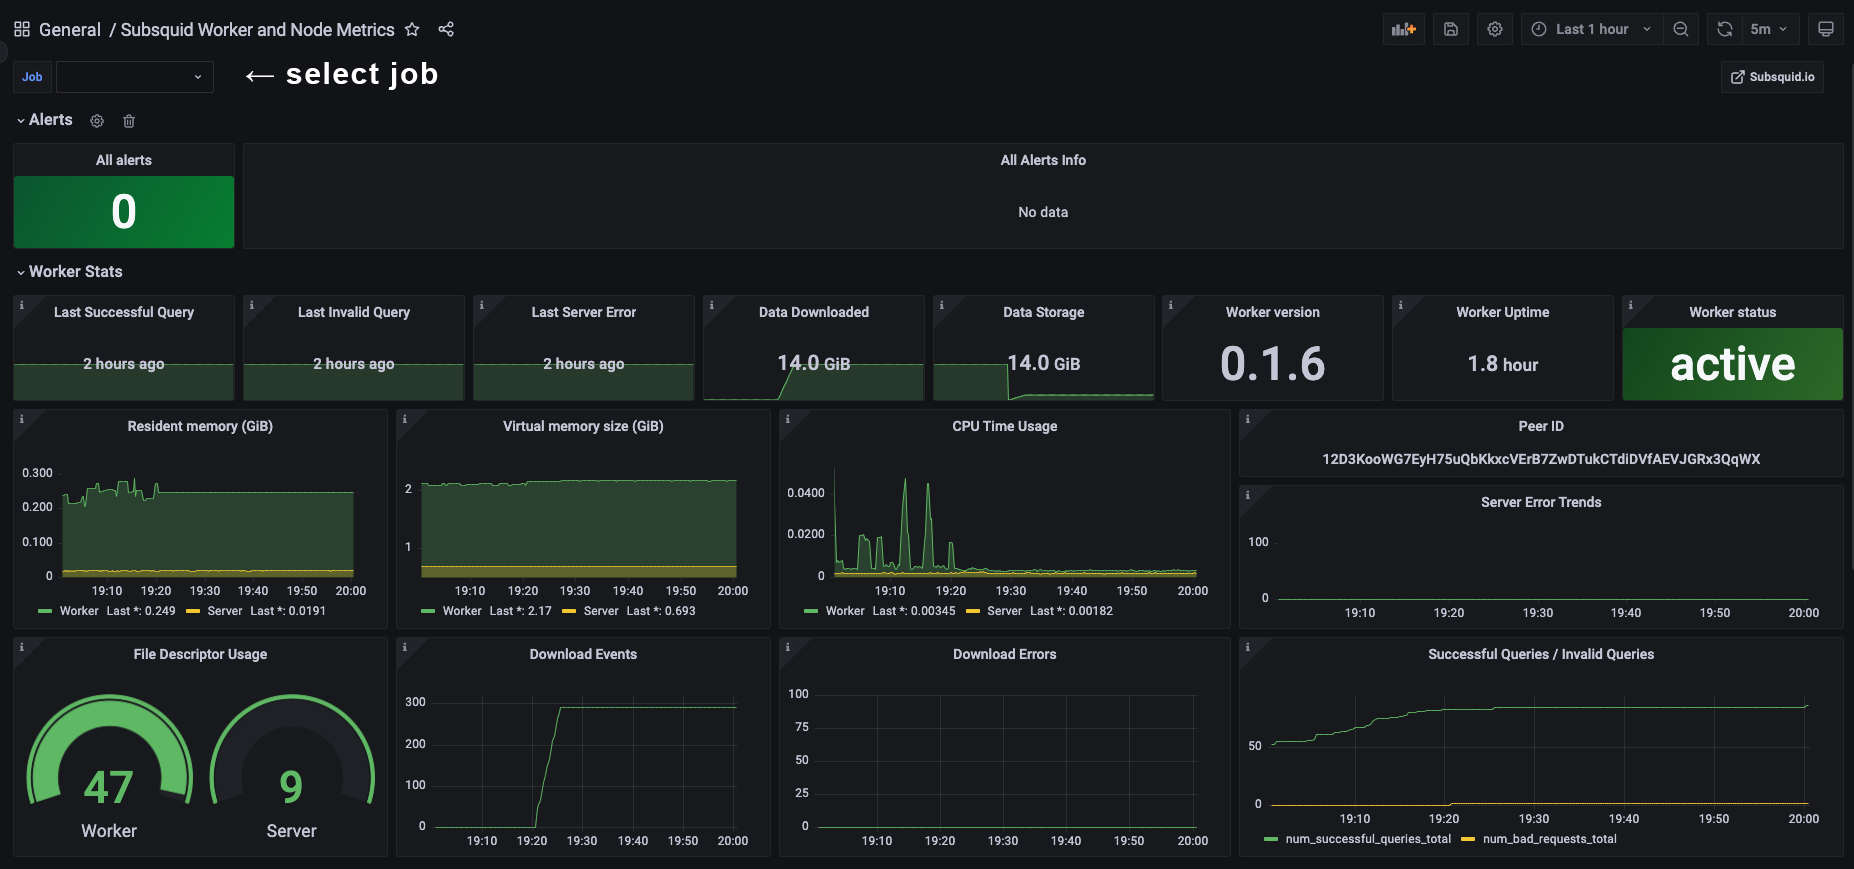
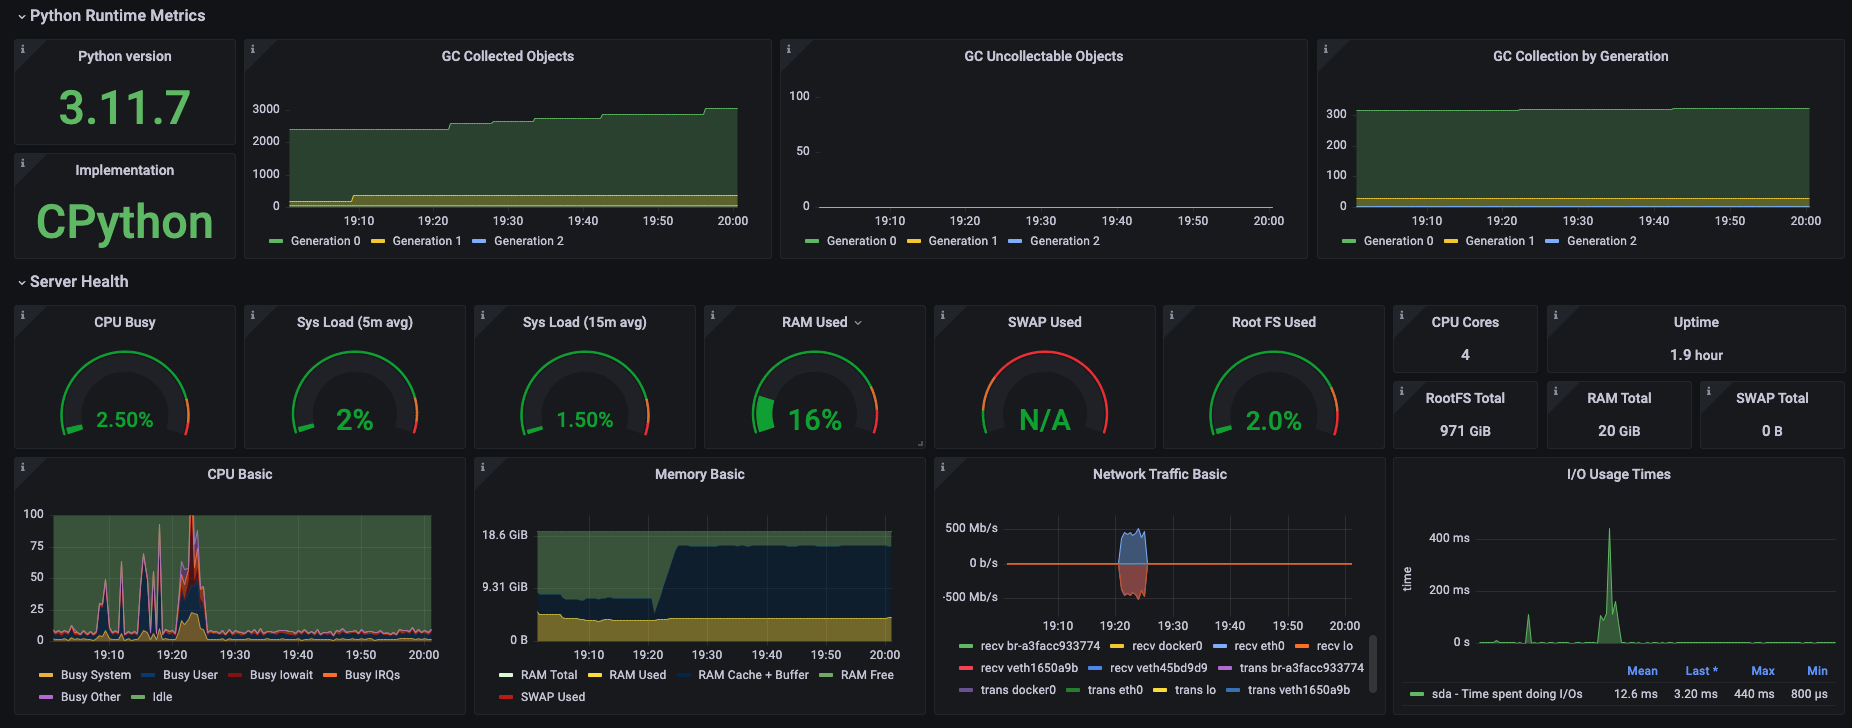
Subsquid Worker Dashboard
Subsquid Worker and Node Metrics Dashboard. A community-created dashboard for monitoring Subsquid nodes and workers, offering key performance metrics ideal for node operations. GITHUB: https://github.com/leadnodeIO/subsquid-worker-dashboard
This initial version will undergo enhancements progressively, such as alerts, better metrics ...
If you're managing more than one worker/server, you can select the job at the top left.
NOTE: Altering the default port settings for the Subsquid Prometheus exporter may impact certain variables or transformations. This dashboard is configured with the assumption that the Subsquid exporter uses port 9090 and node-exporter uses port 9100. Panel customization may be necessary if you use non-standard port configurations.
Data source config
Collector config:
Upload an updated version of an exported dashboard.json file from Grafana
| Revision | Description | Created | |
|---|---|---|---|
| Download |


