Claudie Dashboard
A dedicated dashboard for the Claudie open-source project that display basic information about:
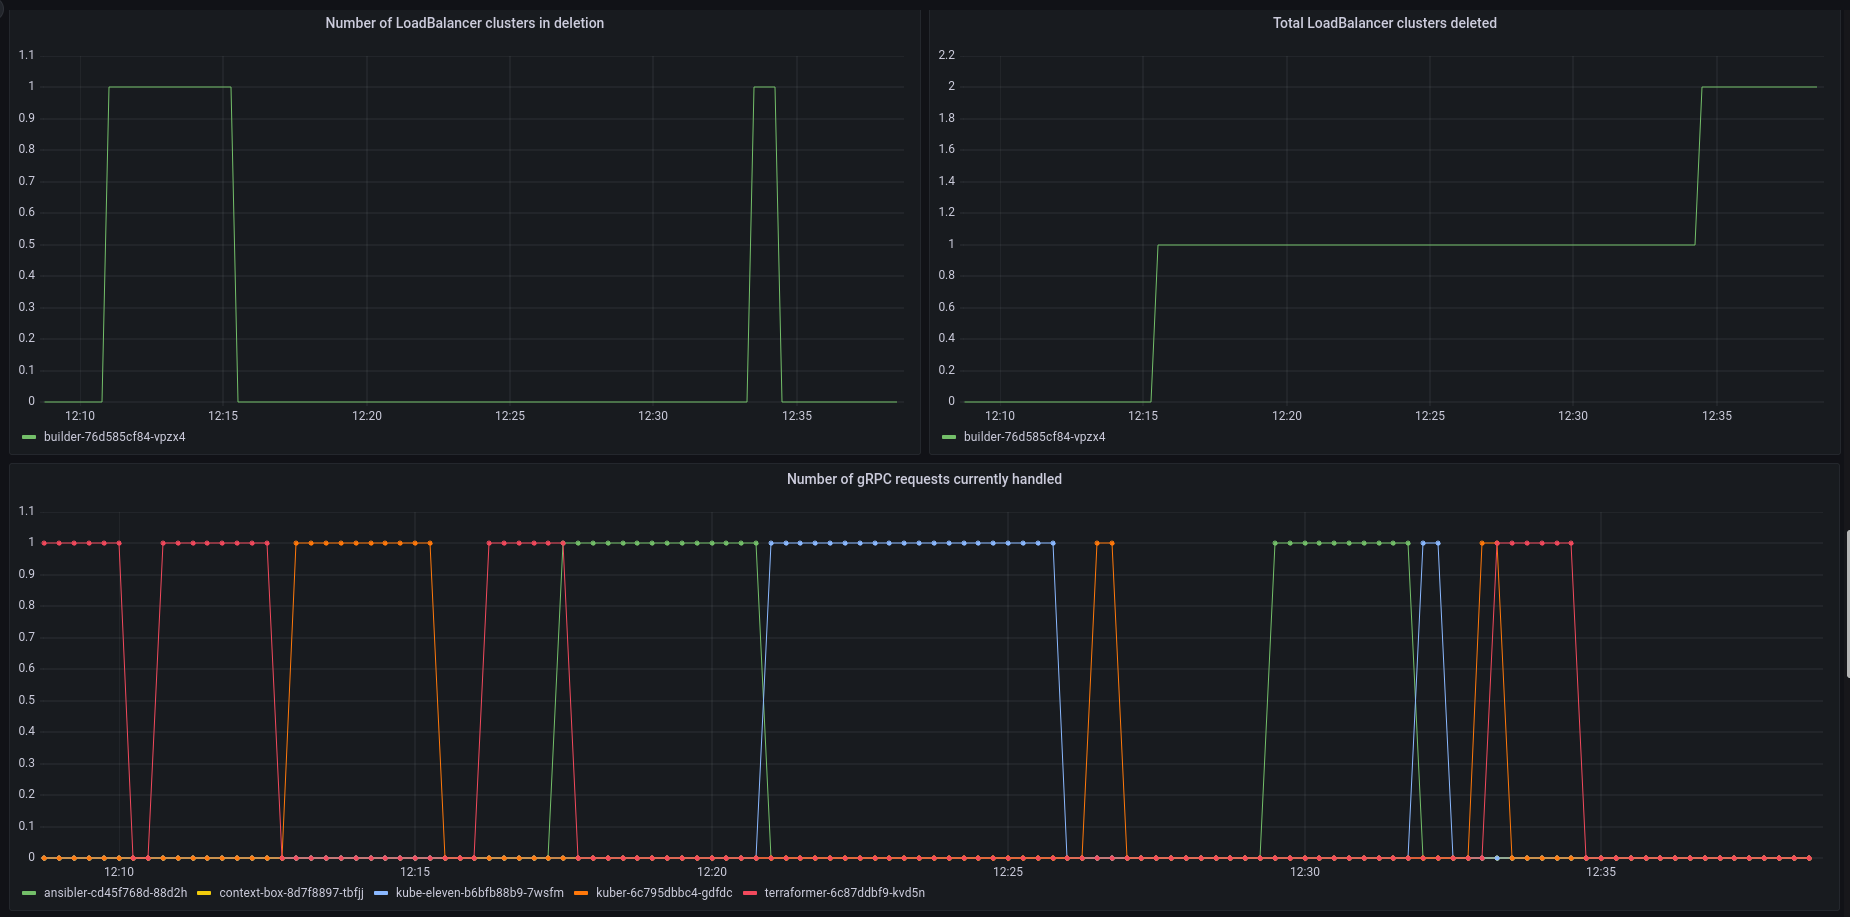
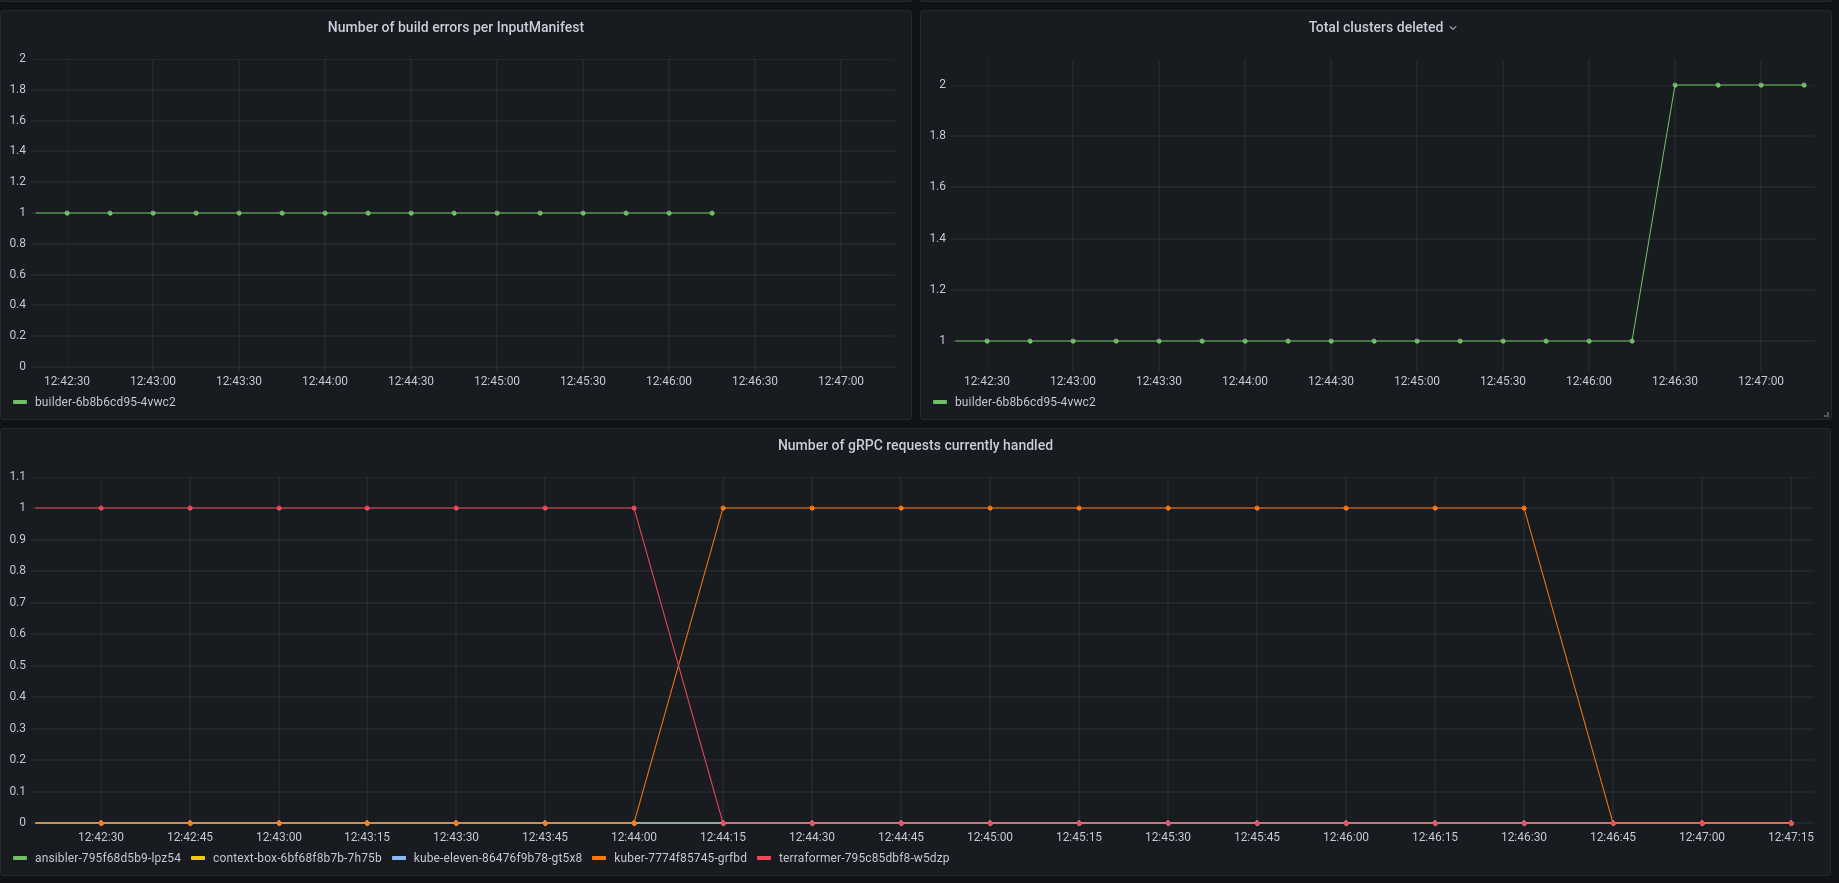
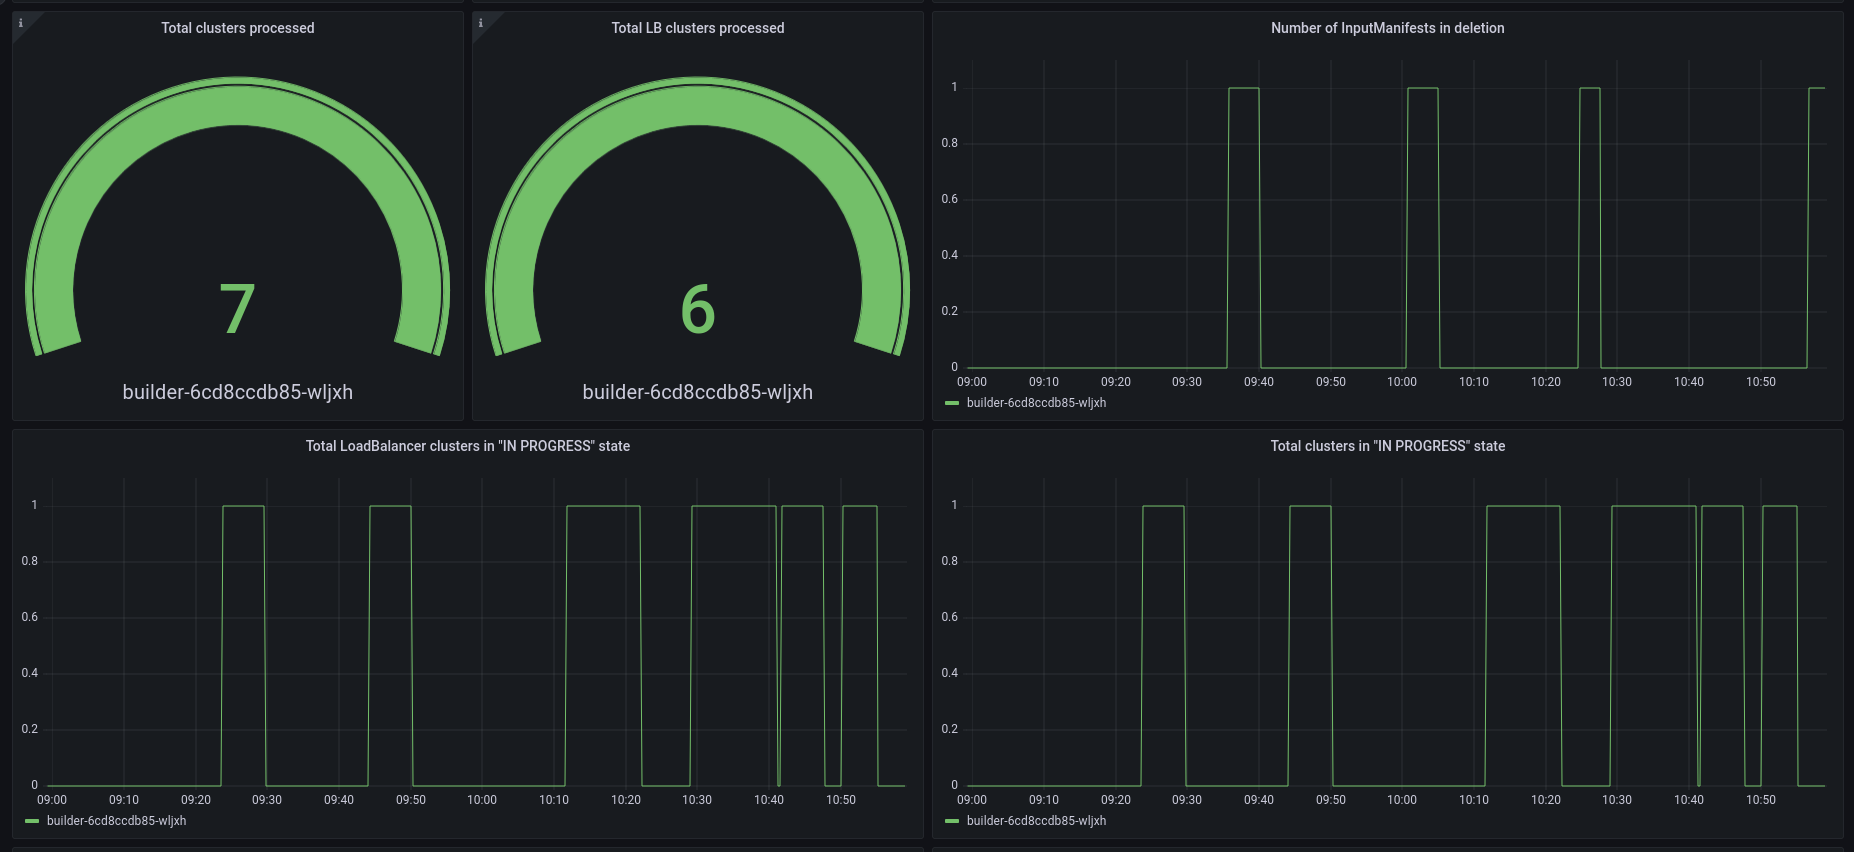
- Number of managed K8s clusters created by Claudie
- Number of managed LoadBalancer clusters created by Claudie
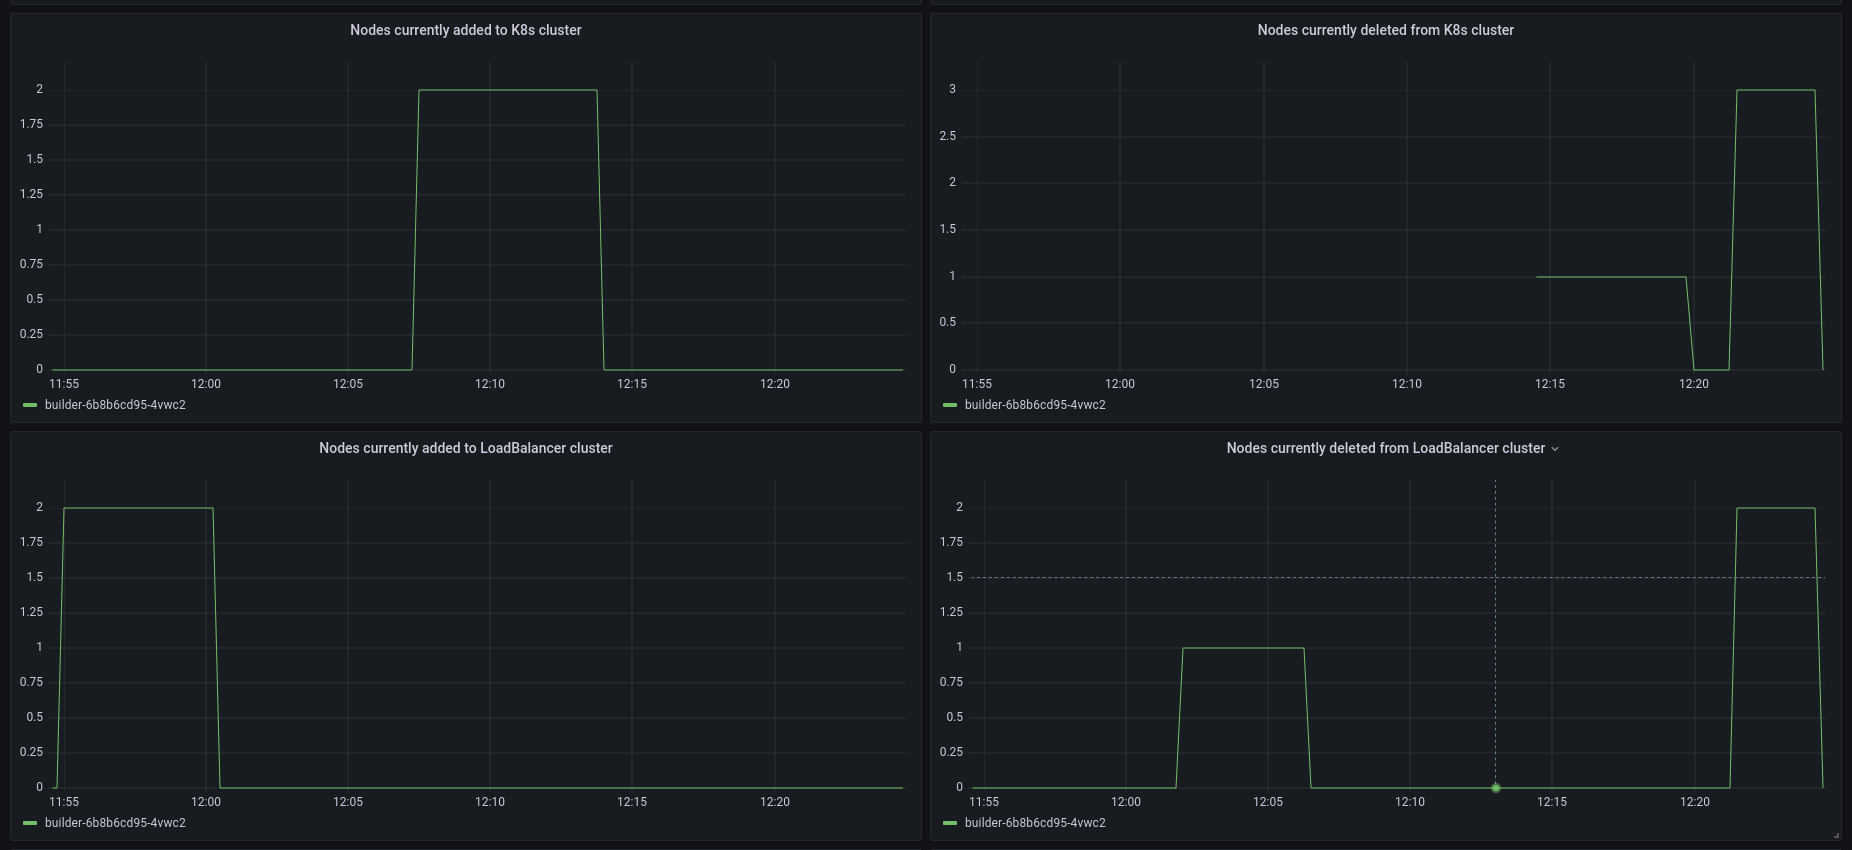
- Currently added/deleted nodes to/from K8s/LB cluster
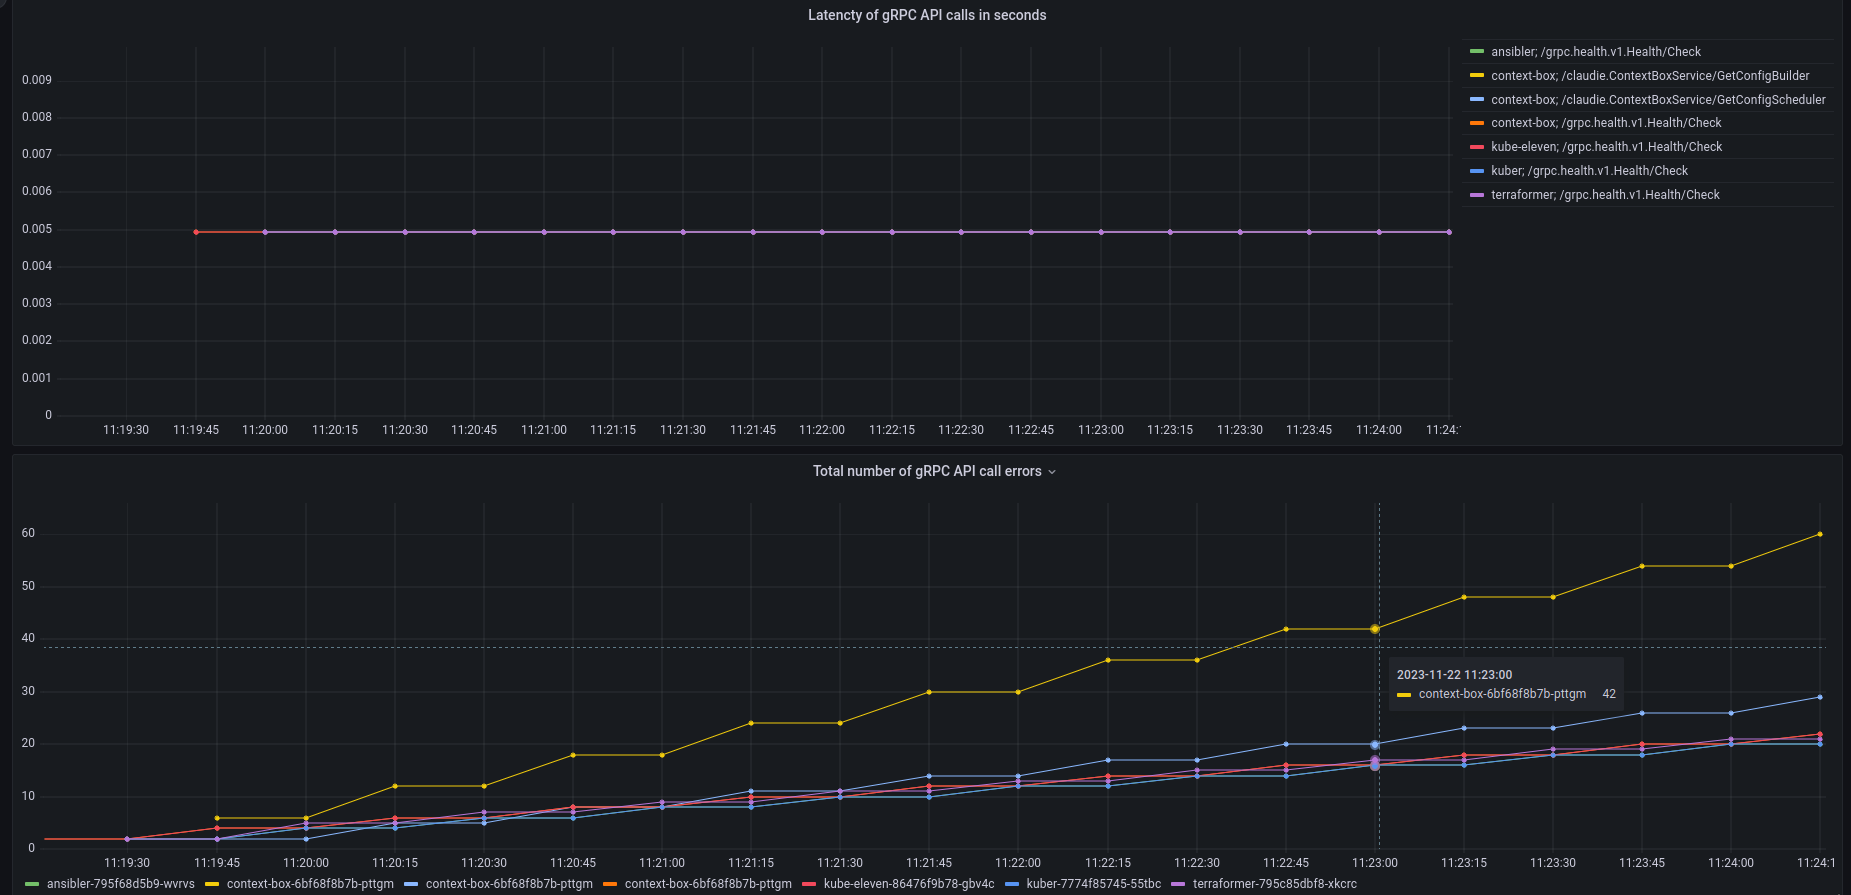
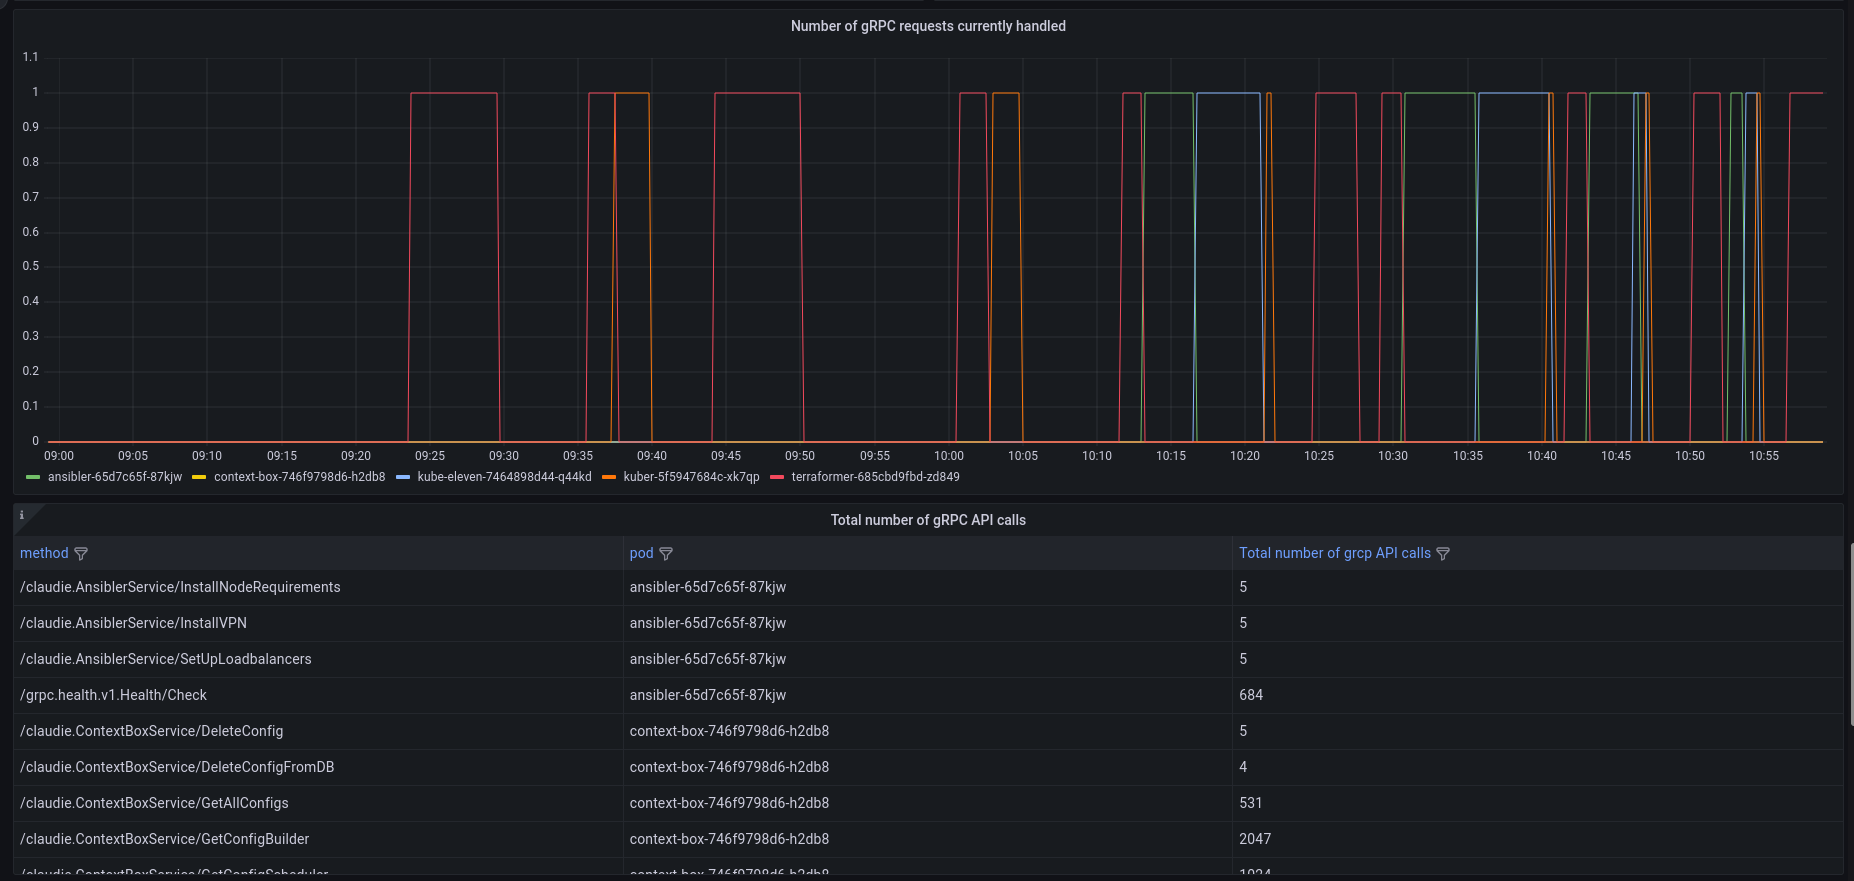
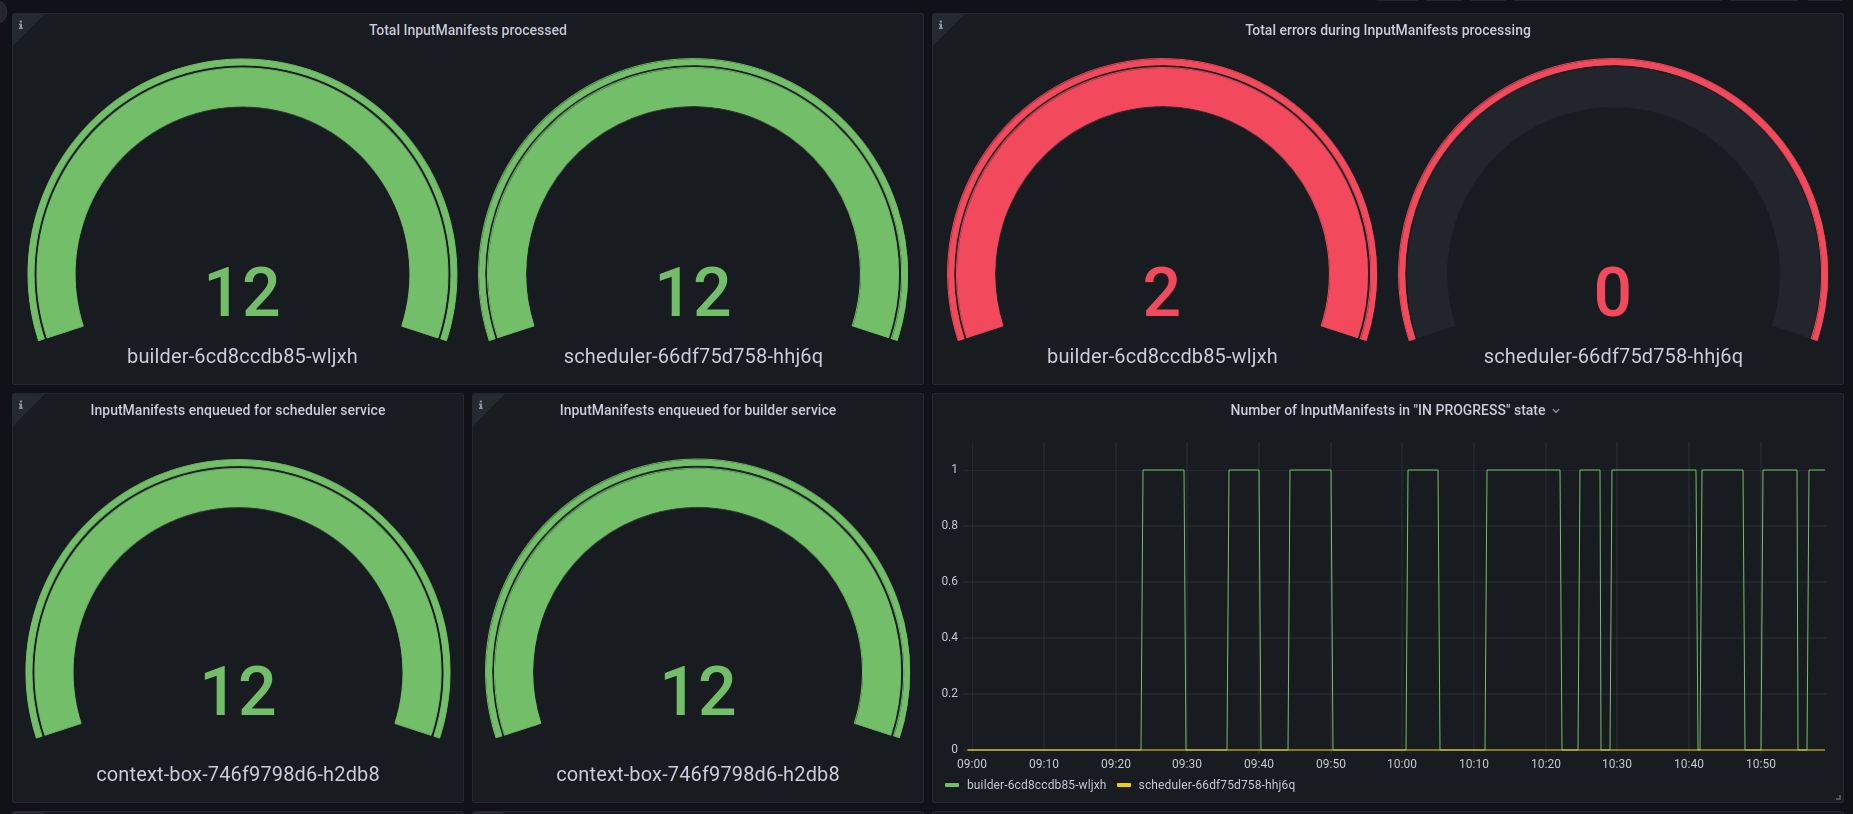
- Information about gRPC requests
- and much more
Installation
- Install Claudie
- Import the dashboard
- Create an RBAC that allows Prometheus to scrape metrics from Claudie's pods
apiVersion: rbac.authorization.k8s.io/v1
kind: Role
metadata:
  name: claudie-pod-reader
  namespace: claudie
rules:
- apiGroups: [""]
  resources: ["pods"]
  verbs: ["get", "list"]
---
apiVersion: rbac.authorization.k8s.io/v1
kind: RoleBinding
metadata:
  name: claudie-pod-reader-binding
  namespace: claudie
subjects:
# this SA is created by https://github.com/prometheus-operator/kube-prometheus
# in your case you might need to bind this Role to a different SA
- kind: ServiceAccount
  name: prometheus-k8s
  namespace: monitoring
roleRef:
  kind: Role
  name: claudie-pod-reader
  apiGroup: rbac.authorization.k8s.io
- Create Prometheus PodMonitor to scrape metrics from Claudie's pods
apiVersion: monitoring.coreos.com/v1
kind: PodMonitor
metadata:
  name: claudie-metrics
  namespace: monitoring
  labels:
    name: claudie-metrics
spec:
  namespaceSelector:
    matchNames:
      - claudie
  selector:
    matchLabels:
      app.kubernetes.io/part-of: claudie
  podMetricsEndpoints:
  - port: metrics
Data source config
Collector type:
Collector plugins:
Collector config:
Revisions
Upload an updated version of an exported dashboard.json file from Grafana
| Revision | Description | Created | |
|---|---|---|---|
| Download |