Prometheus Stats
The official, pre-built Prometheus Stats Dashboard.
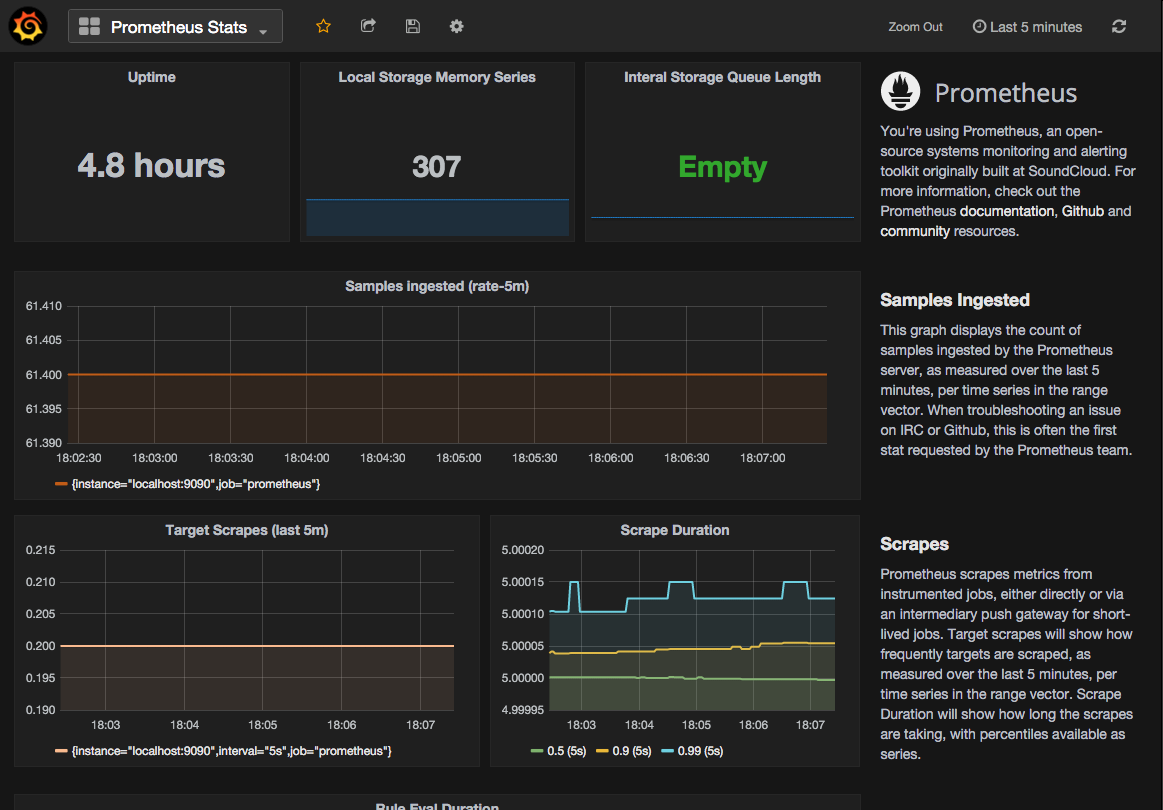
This is the Prometheus dashboard that comes bundled with Grafana. You can also find it under the Dashboards tab in the Prometheus Data Source Settings and import it directly from there.
How to use the dashboard is described in Matt Toback's blog post on How To Add a Prometheus Dashboard to Grafana.
Help Make this dashboard better
For feedback and ideas to improve this dashboard please open an issue here: https://github.com/grafana/grafana
Data source config
Collector type:
Collector plugins:
Collector config:
Revisions
Upload an updated version of an exported dashboard.json file from Grafana
| Revision | Description | Created | |
|---|---|---|---|
| Download |
Metrics Endpoint (Prometheus)
Easily monitor any Prometheus-compatible and publicly accessible metrics URL with Grafana Cloud's out-of-the-box monitoring solution.
Learn more