Telepresence
This dashboard offers advanced monitoring and visualization features for efficient Telepresence environment management.
The Telepresence Grafana Dashboard is tailored for efficient management and oversight of your Telepresence setup. It offers an array of monitoring and visualization options.
To start, access guidelines on integrating Prometheus metrics with your Traffic Manager at this link.
Data Source
- Prometheus (Referenced as
DS_PROMETHEUS)
Panel Configurations
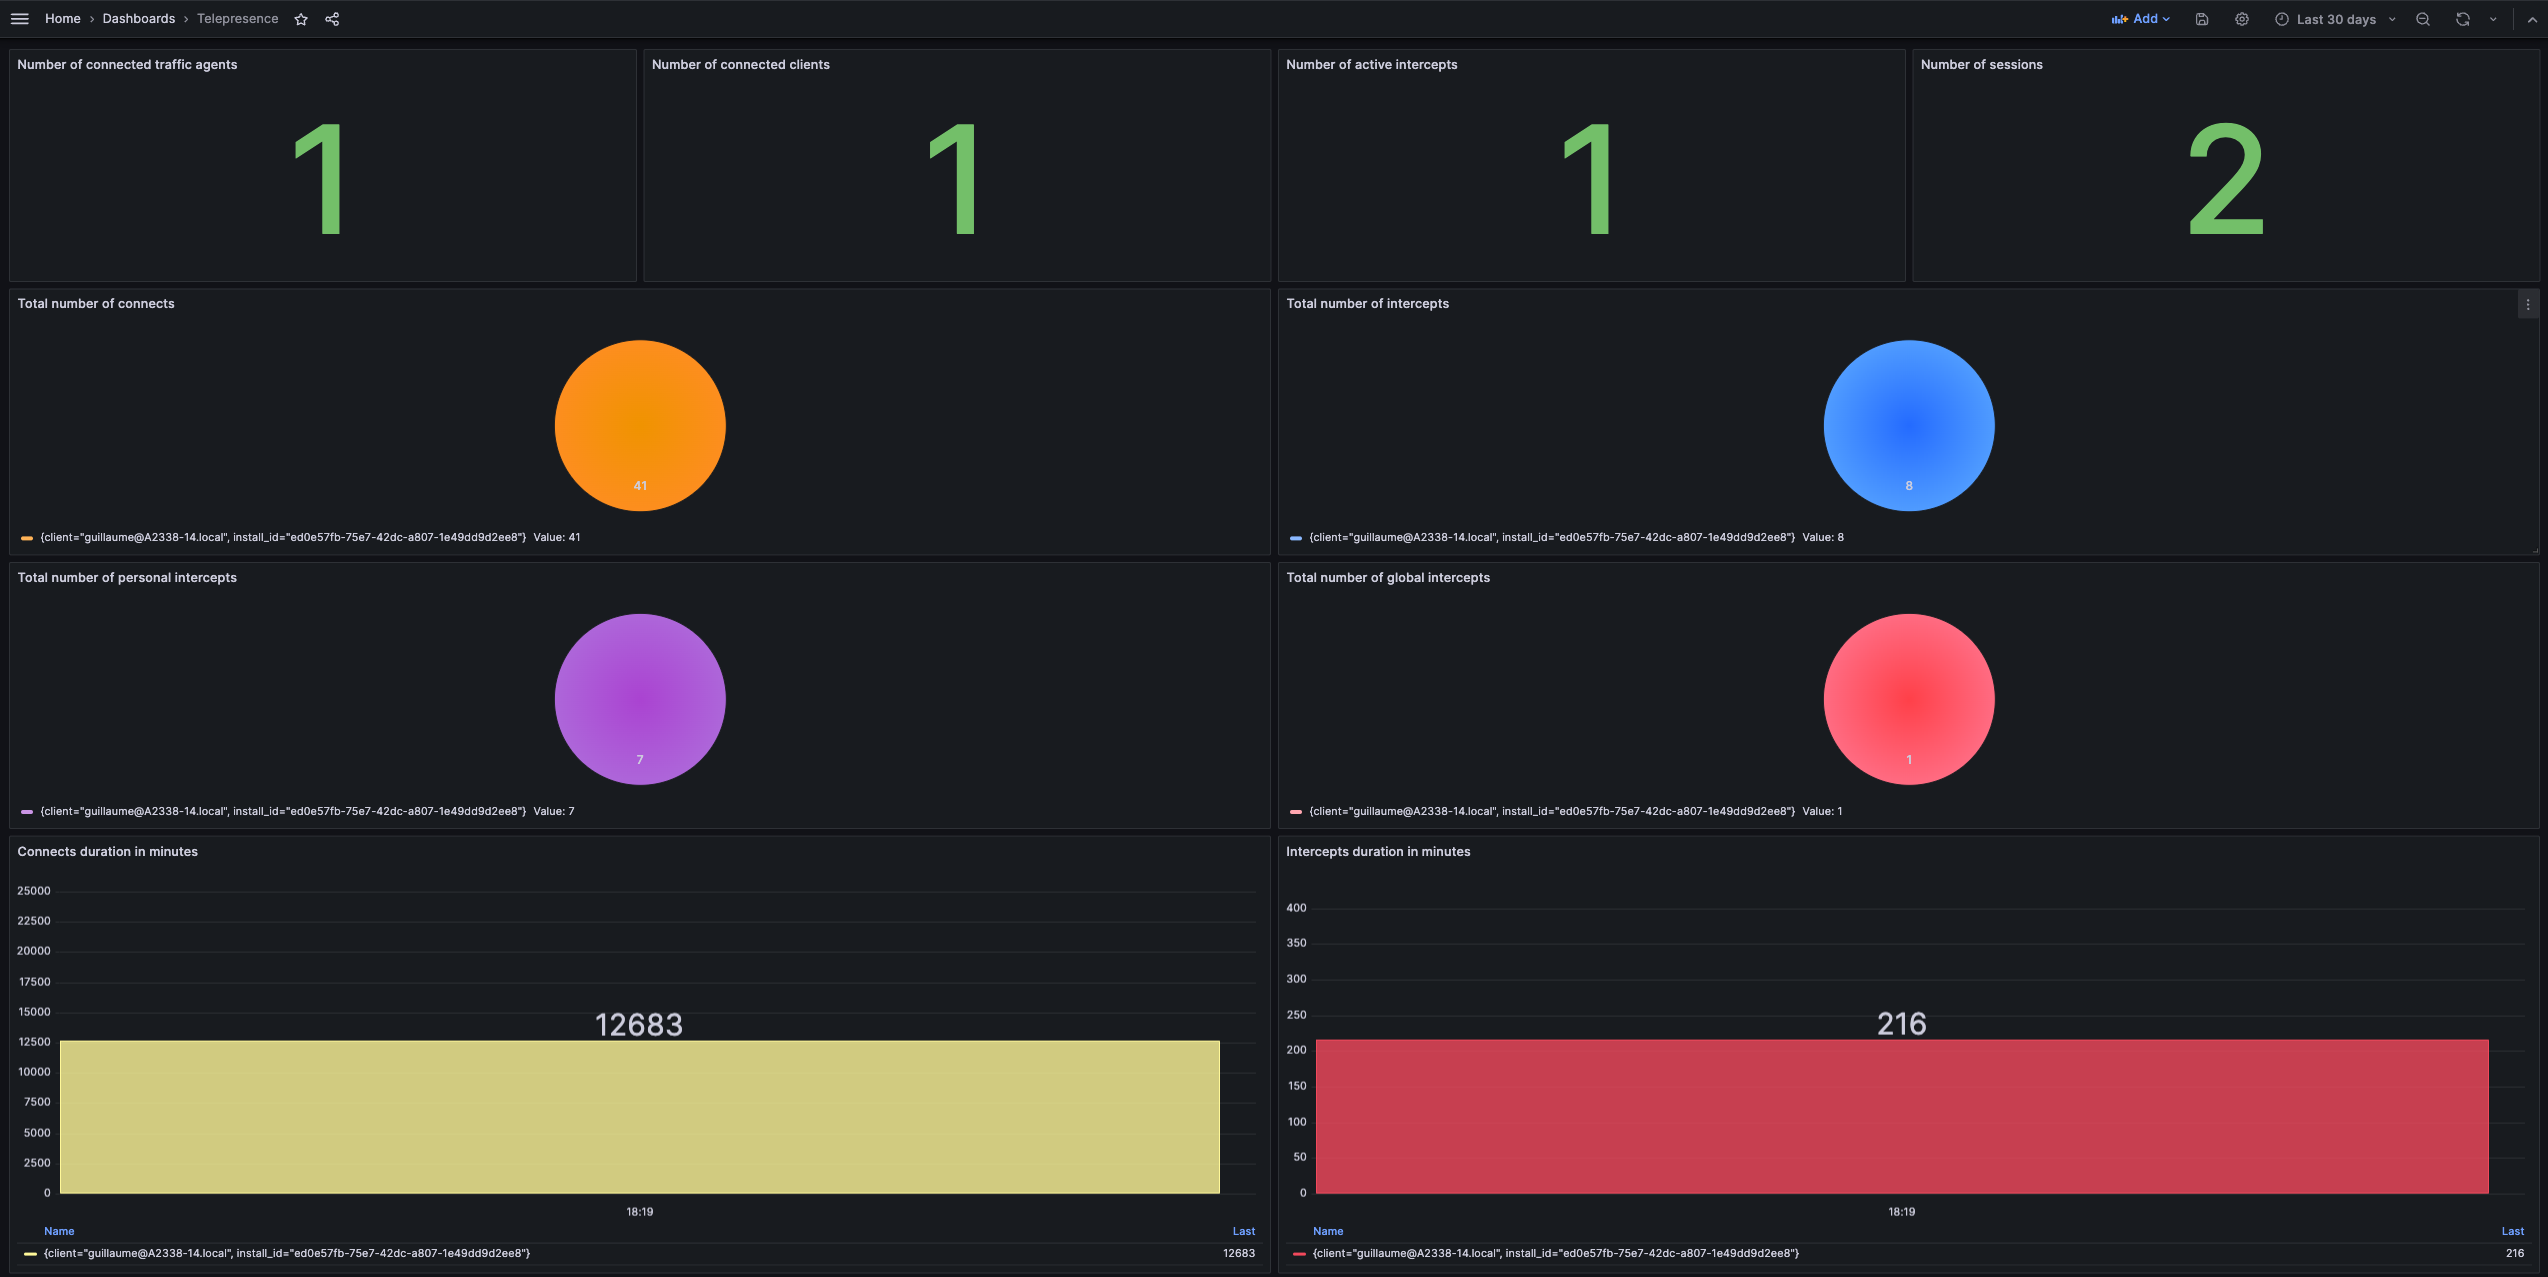
Stat Panels
- Track key metrics like the number of connected clients, traffic agents, active intercepts, and sessions.
- Utilize thresholds to visually indicate performance levels.
Pie Charts
- Display data such as total number of connects and intercepts (including personal and global types) in a pie chart format.
- Custom color configurations for clarity.
Bar Charts
- Show durations of connects and intercepts in minutes.
- Configured with a continuous color scheme for easy interpretation.
Data source config
Collector type:
Collector plugins:
Collector config:
Revisions
Upload an updated version of an exported dashboard.json file from Grafana
| Revision | Description | Created | |
|---|---|---|---|
| Download |