Windows Server Summary
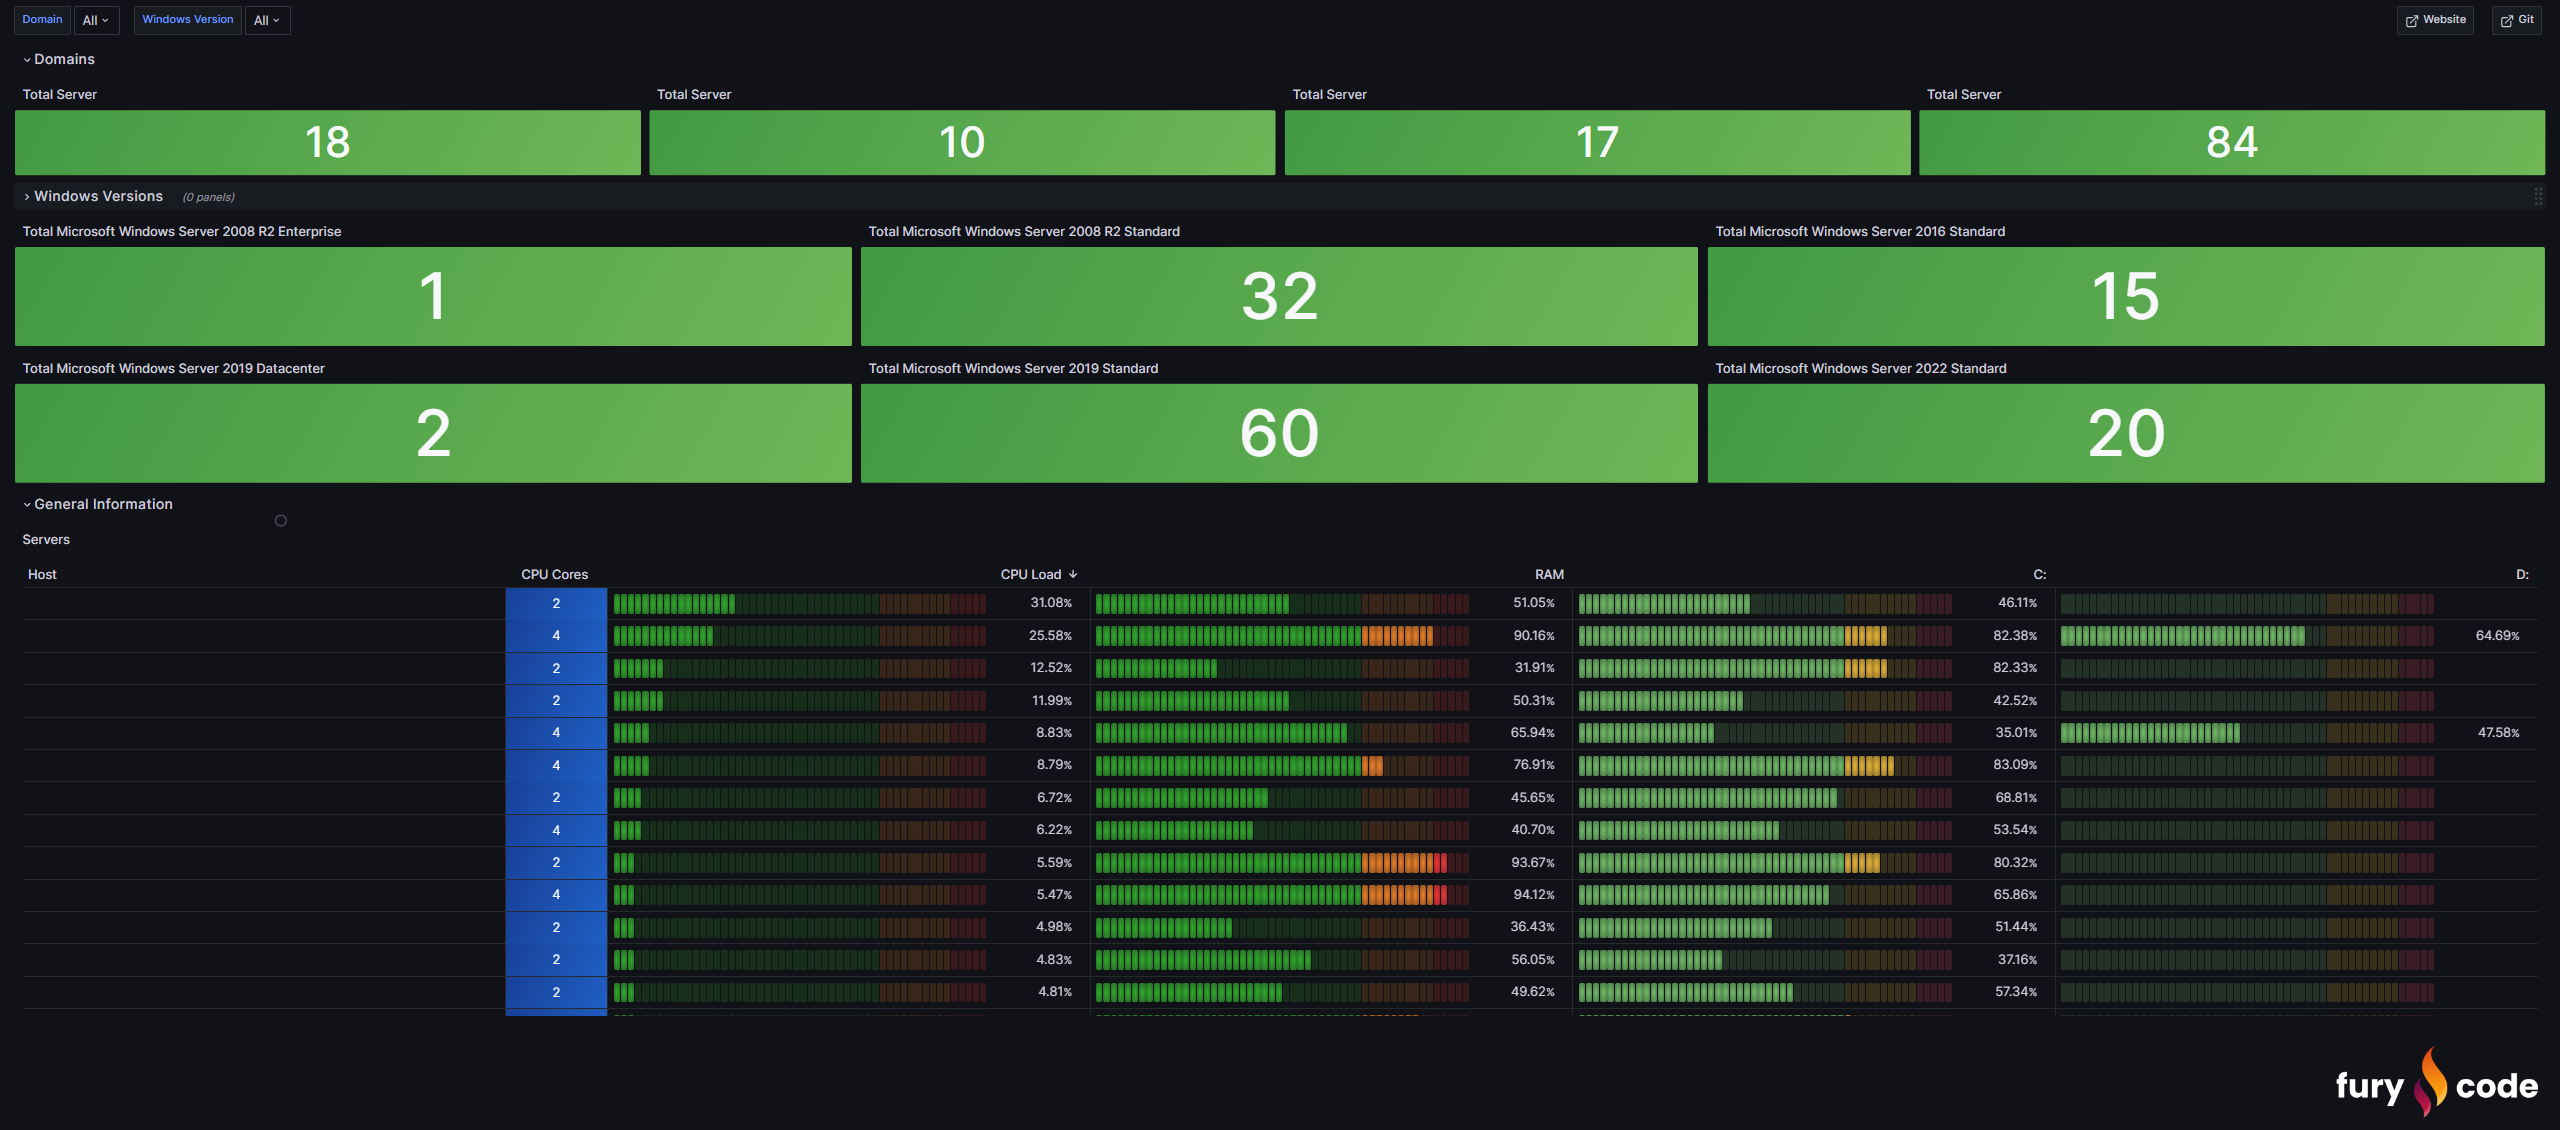
Once you import the Windows Server Summary Dashboard, it will appear as shown (Please note that some data has been blacked out in the images for privacy reasons).
This dashboard provides a summary of the following metrics for your Windows servers:
- Domains (Shows the count of servers in each domain)
- Windows Versions (Displays the number of Windows servers and their respective operating system versions)
- Host (Shows the hostname of the server)
- CPU Load (Indicates the CPU usage as a percentage of the server)
- RAM (Reflects the RAM usage as a percentage of the server)
- Storage (Illustrates the used storage as a percentage of the server)
You can find more information here: Git
Data source config
Collector config:
Upload an updated version of an exported dashboard.json file from Grafana
| Revision | Description | Created | |
|---|---|---|---|
| Download |
Windows
Easily monitor your deployment of the Windows operating system with Grafana Cloud's out-of-the-box monitoring solution.
Learn more
