Jmeter Consolidated Dashboard (Influxdb 2.x Using Flux)
JMeter performance testing live results dashboard, utilizing Flux queries (Influxdb 2.x)
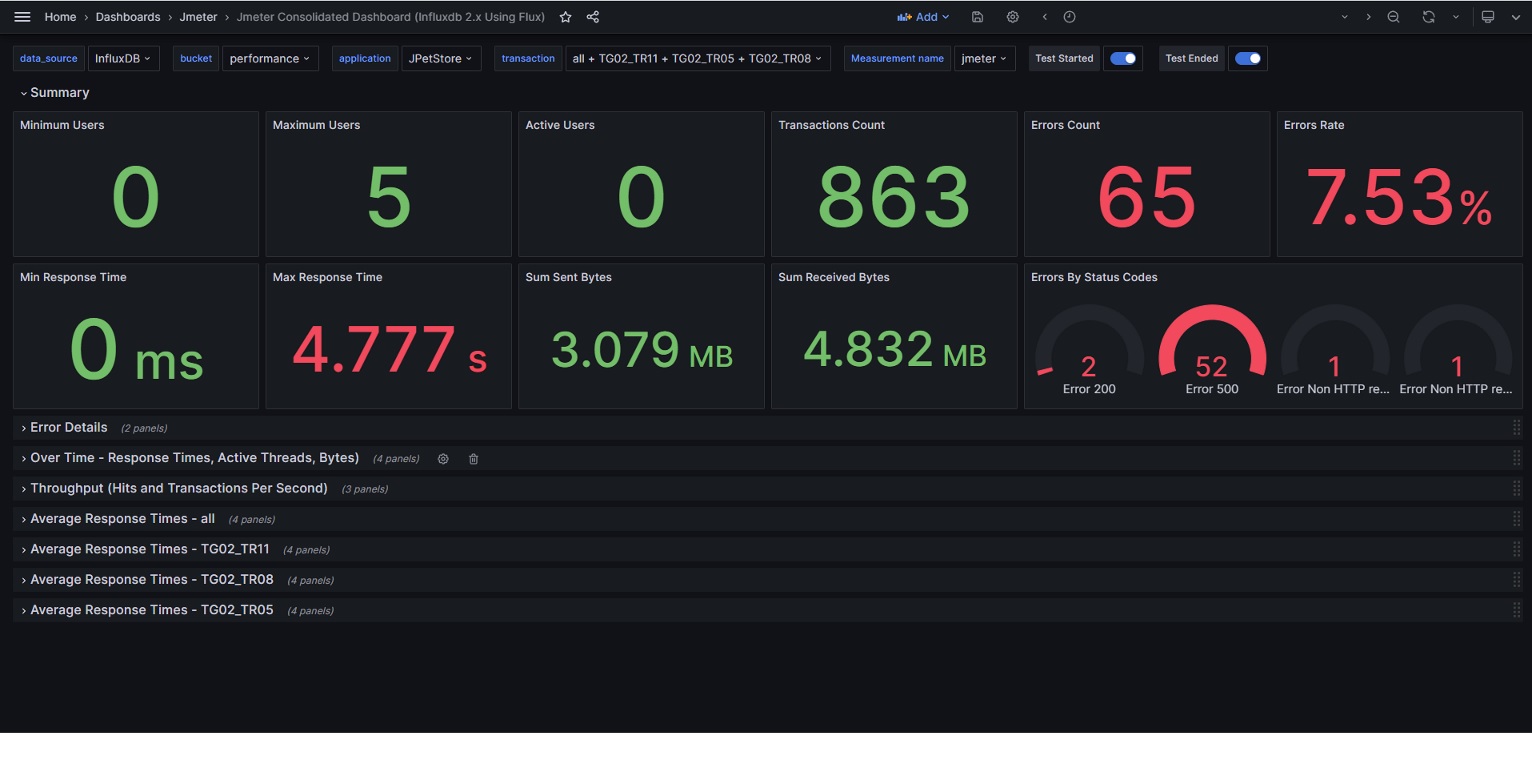
This dashboard can be used for monitoring JMeter performance testing live results, utilizing Flux queries (Influxdb 2.x). InfluxQL queries cannot be used for Influxdb 2.x versions. InfluxQL queries are supported till version 1.8 only and 1.8 onwards Flux needs to be used. With this dashboard, you can monitor your Apache JMeter load test in real time with InfluxDB and Grafana. Get overall summary (Users, Requests, Throughput etc), errors details, network traffic, overall as well as particular transaction response times.
This dashboard requires Apache JMeter 5 and upper versions. This shows overall statistics and even fetch details about specific transaction.
Setup:
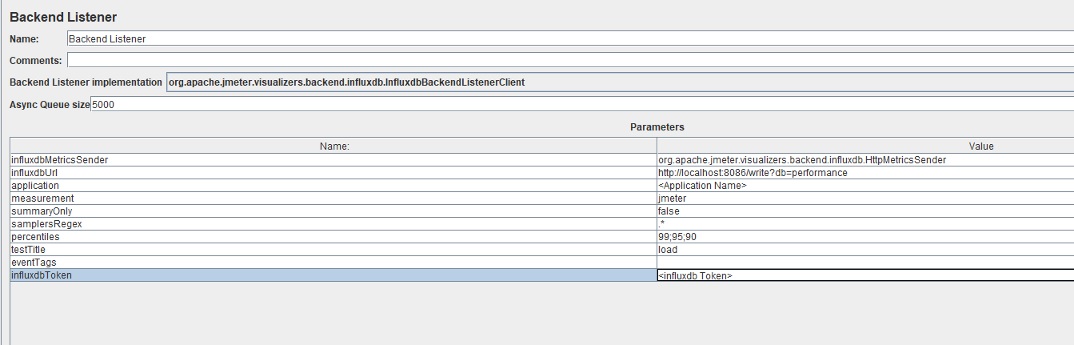
- Add Backend Listener to your test plan (Add -> Listener -> Backend Listener)
- Select "org.apache.jmeter.visualizers.backend.influxdb.InfluxdbBackendListnerClient
- Update below settings:
- influxdbMetricsSender: org.apache.jmeter.visualizers.backend.influxdb.HttpMetricsSender
- influxdbUrl: http://localhost:8086/write?db=
- application:
- measurement: jmeter
- summaryOnly: false (we need all values not just summary)
- samplersRegex: .* (for capturing all samplers)
- percentiles: 99;95;90
- testTitle:
- influxdbToken:
For more details, please refer :
https://jmeter.apache.org/usermanual/component_reference.html#Backend_Listener
https://jmeter.apache.org/usermanual/realtime-results.html
This Grafana dashboard will capture below metrics:
- Number of Users - Minimum and Maximum Users (Threads)
- Active Users/Threads
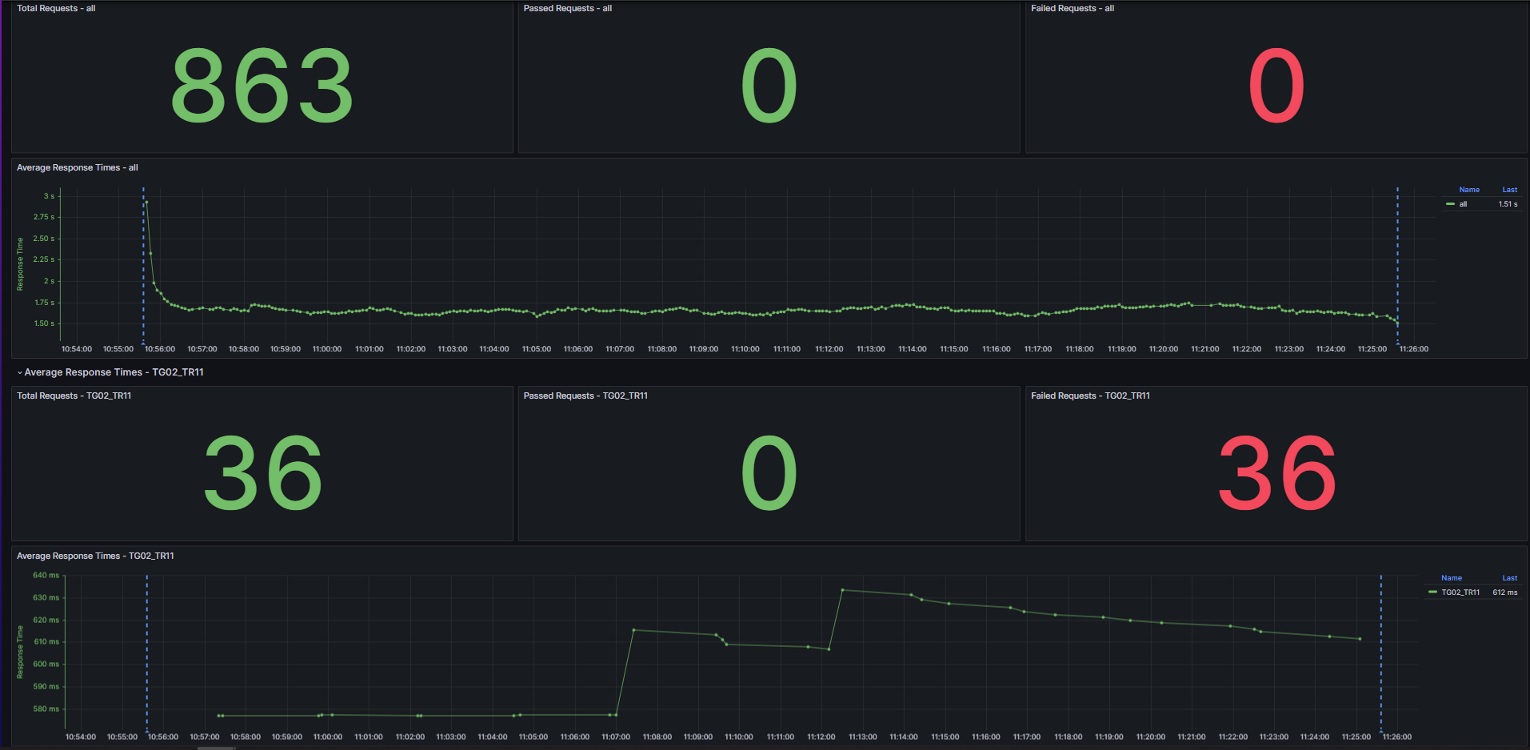
- Total Requests
- Failed Requests
- Failure Rate
- Minimum Response Time
- Maximum Response Time
- Total Sent Bytes
- Total Received Bytes
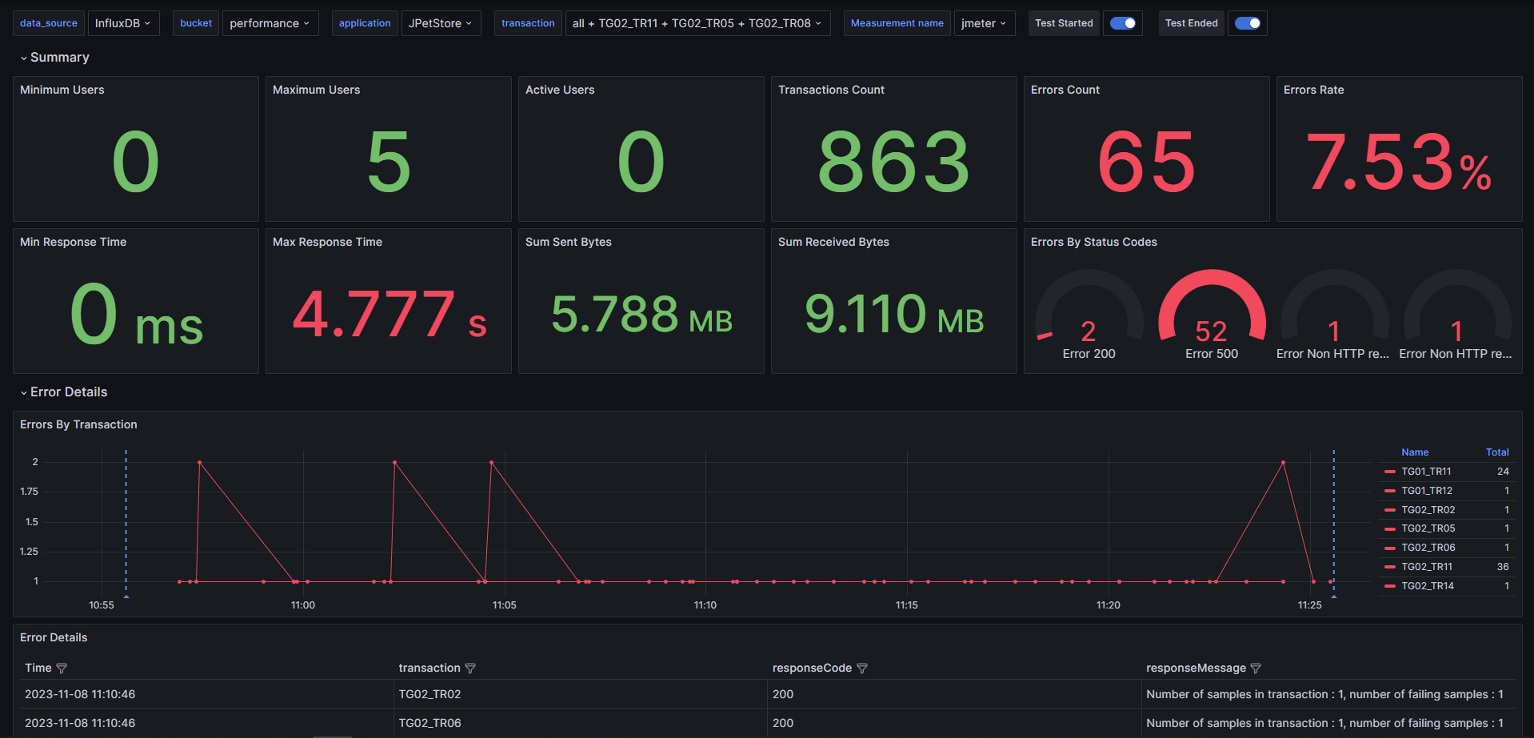
- Errors by Status Codes
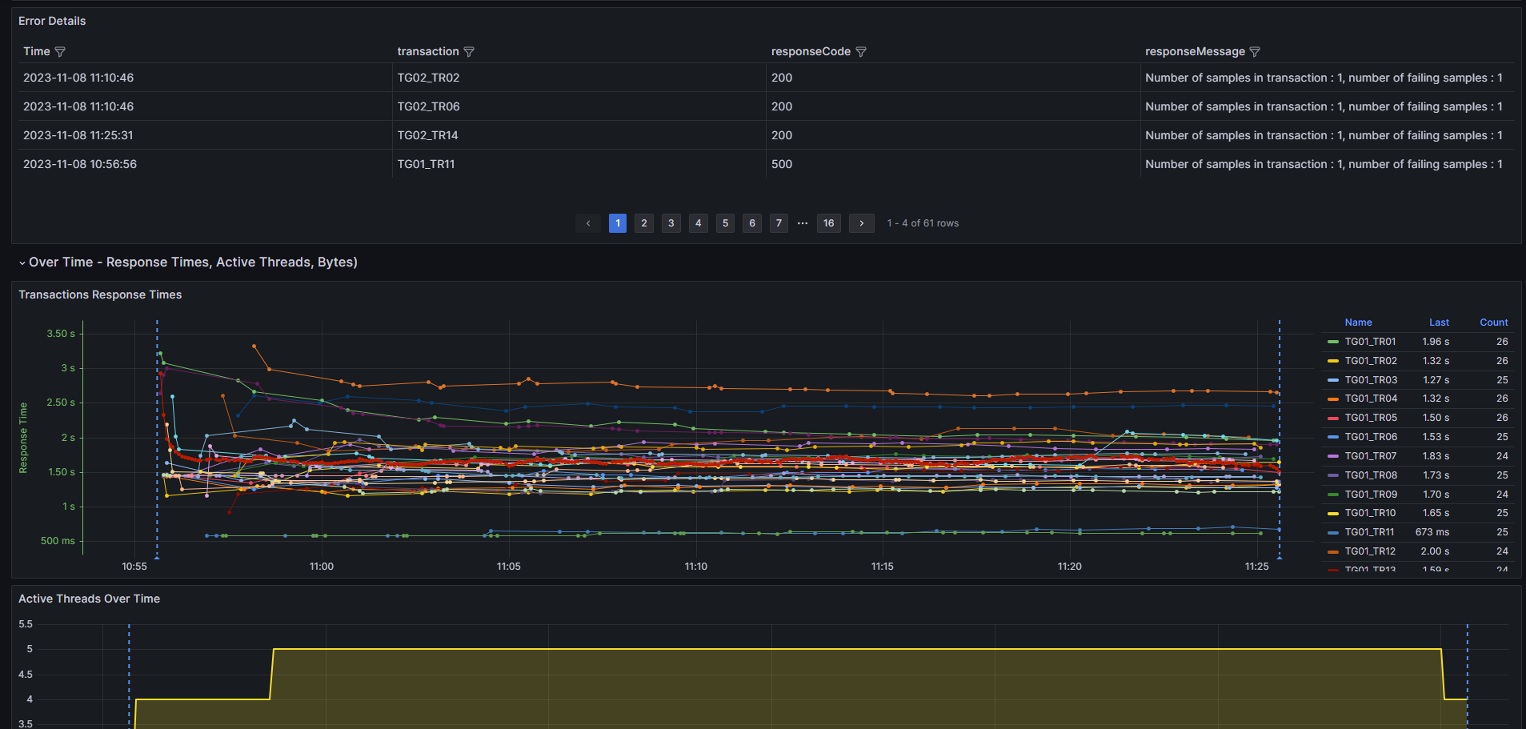
- Error Details, for failed transactions view the respose code and response message
- Average Response Times for all transactions
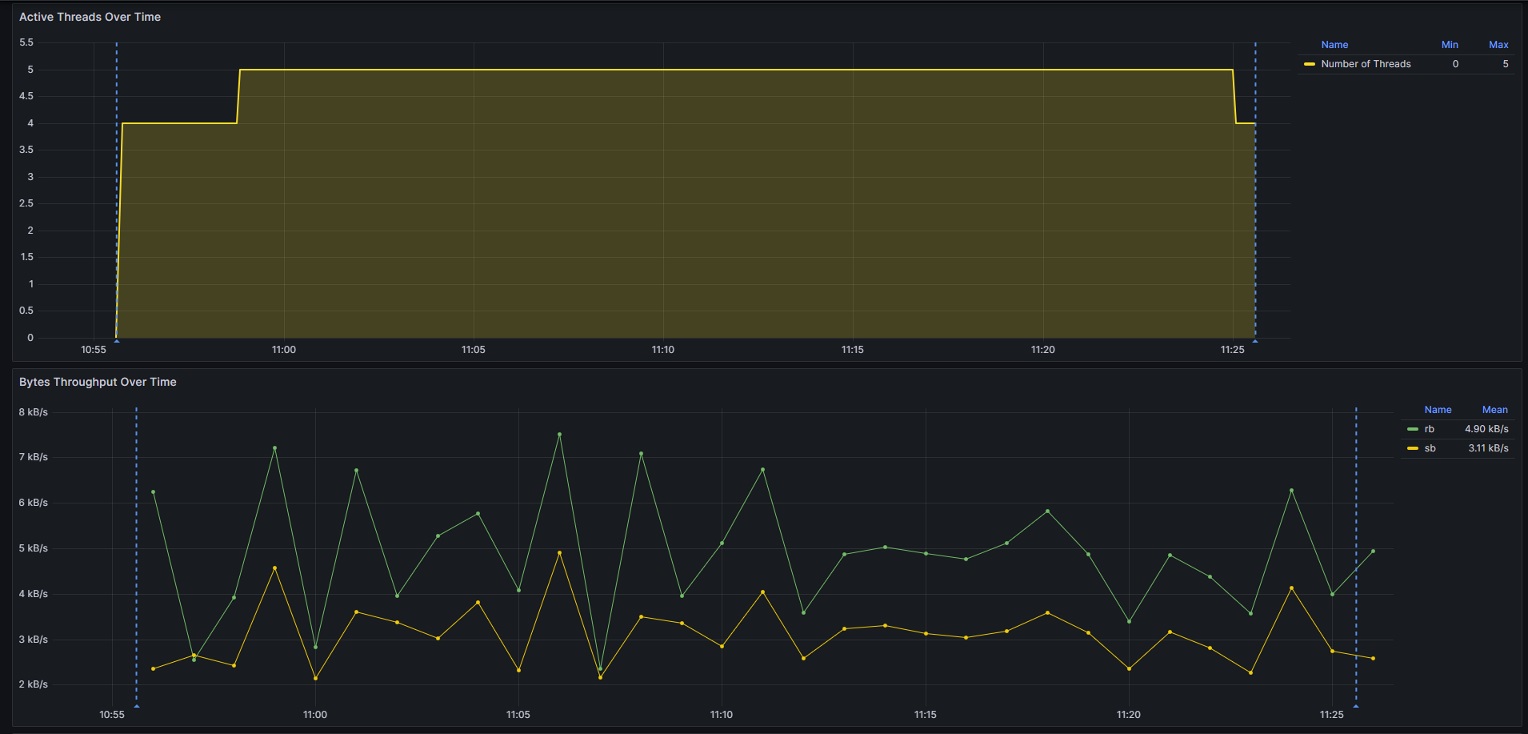
- Active Threads Over Time
- Bytes Throughput during test execution period
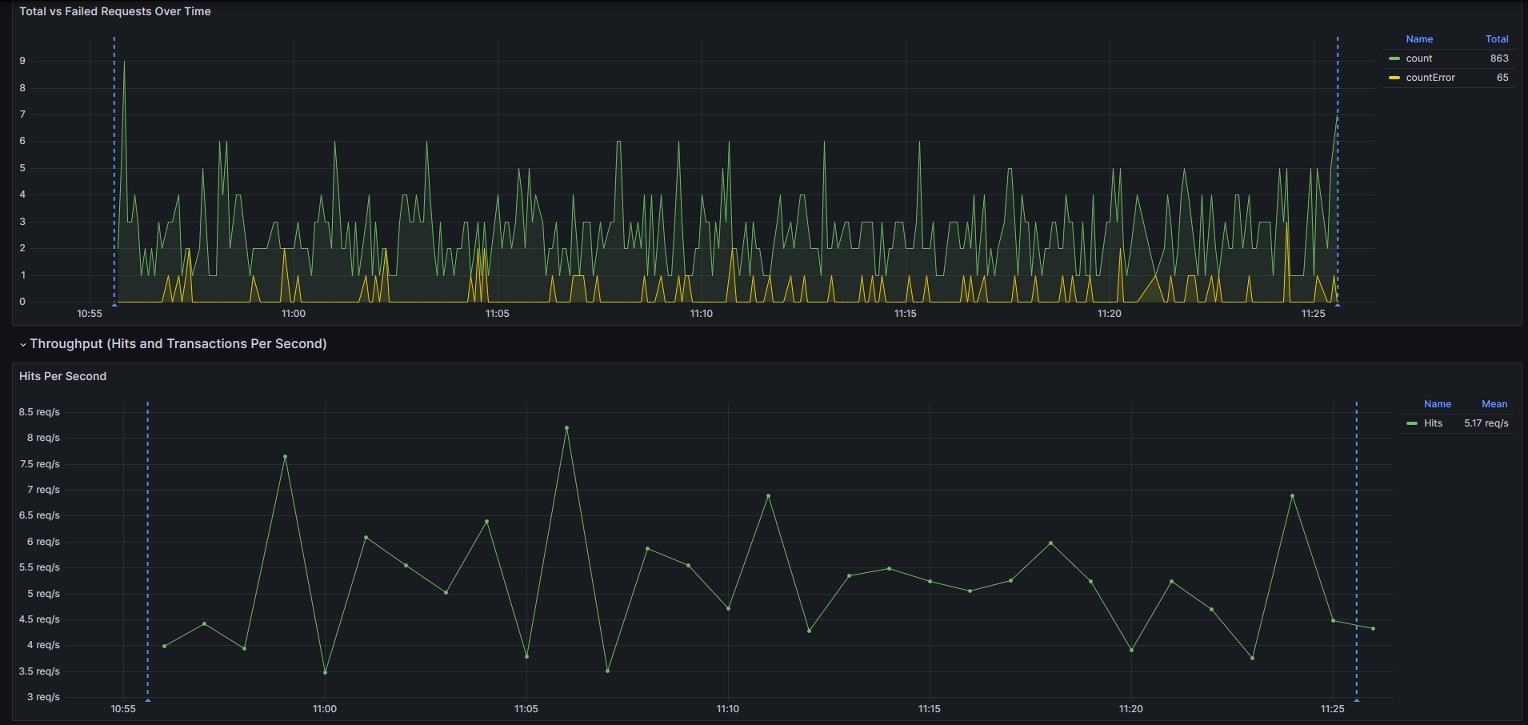
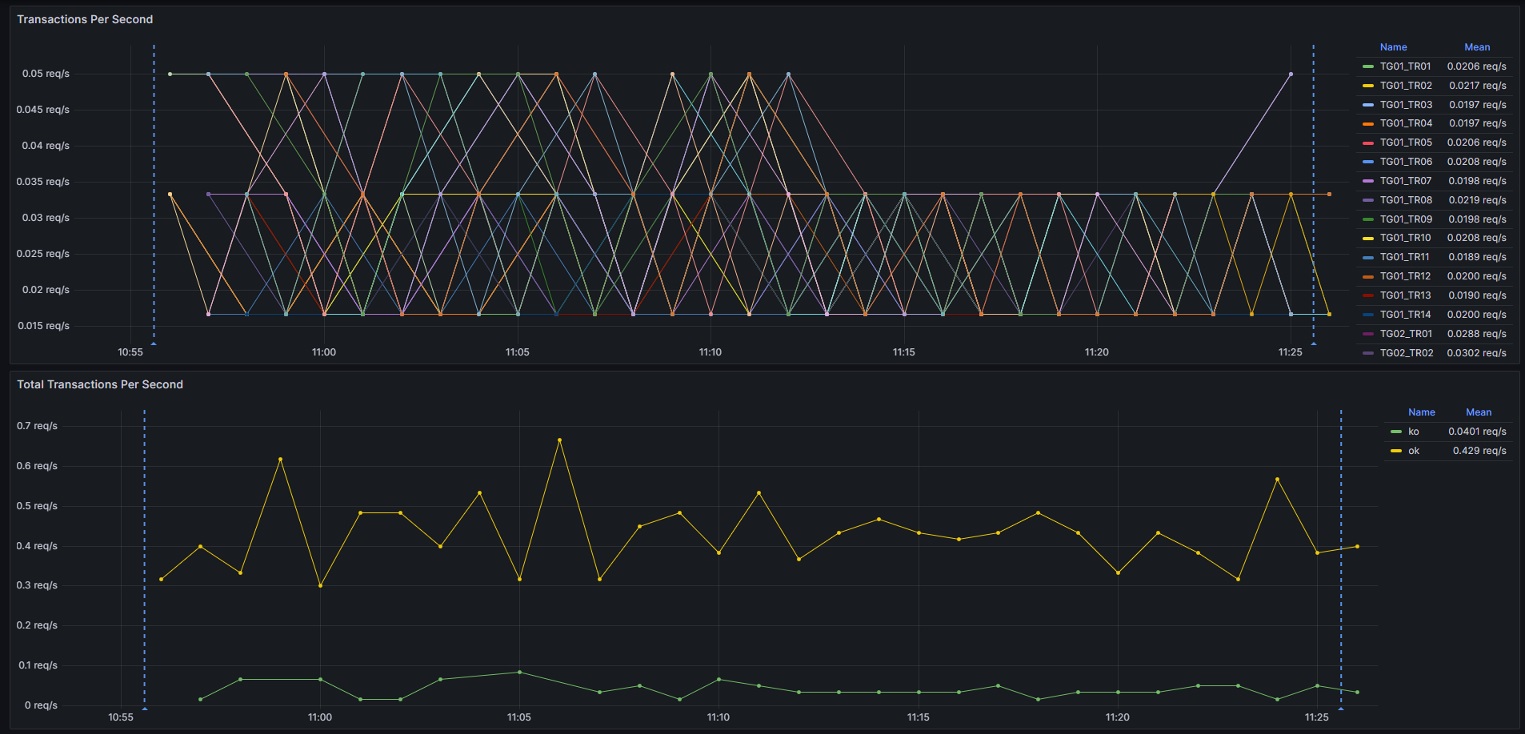
- Total Throughput - Hits and Transactions per second
Below metrics are captured for individual transactions (which are selected under "transaction" dropdown at the top of the dashboard)
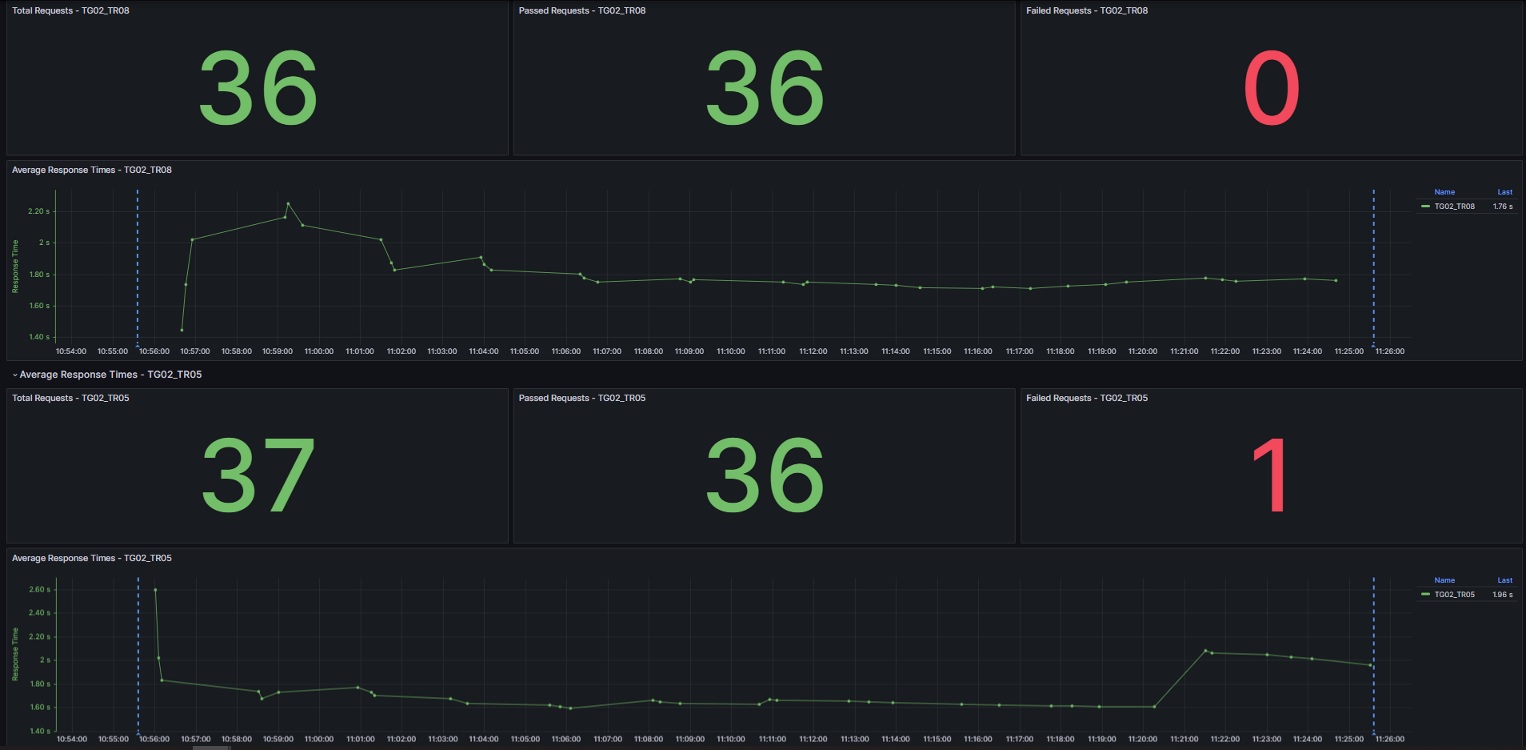
- Total Requests for individual transaction
- Passed and Failed Requests for Individual transaction
- Response Times for Individual Transaction which includes Minimum, Maximum, Average, 90th, 95th & 99th percentiles
Data source config
Collector config:
Upload an updated version of an exported dashboard.json file from Grafana
| Revision | Description | Created | |
|---|---|---|---|
| Download |