Linux Server Overview
Linux Server Overview
Monitor Linux Server with Prometheus and Grafana
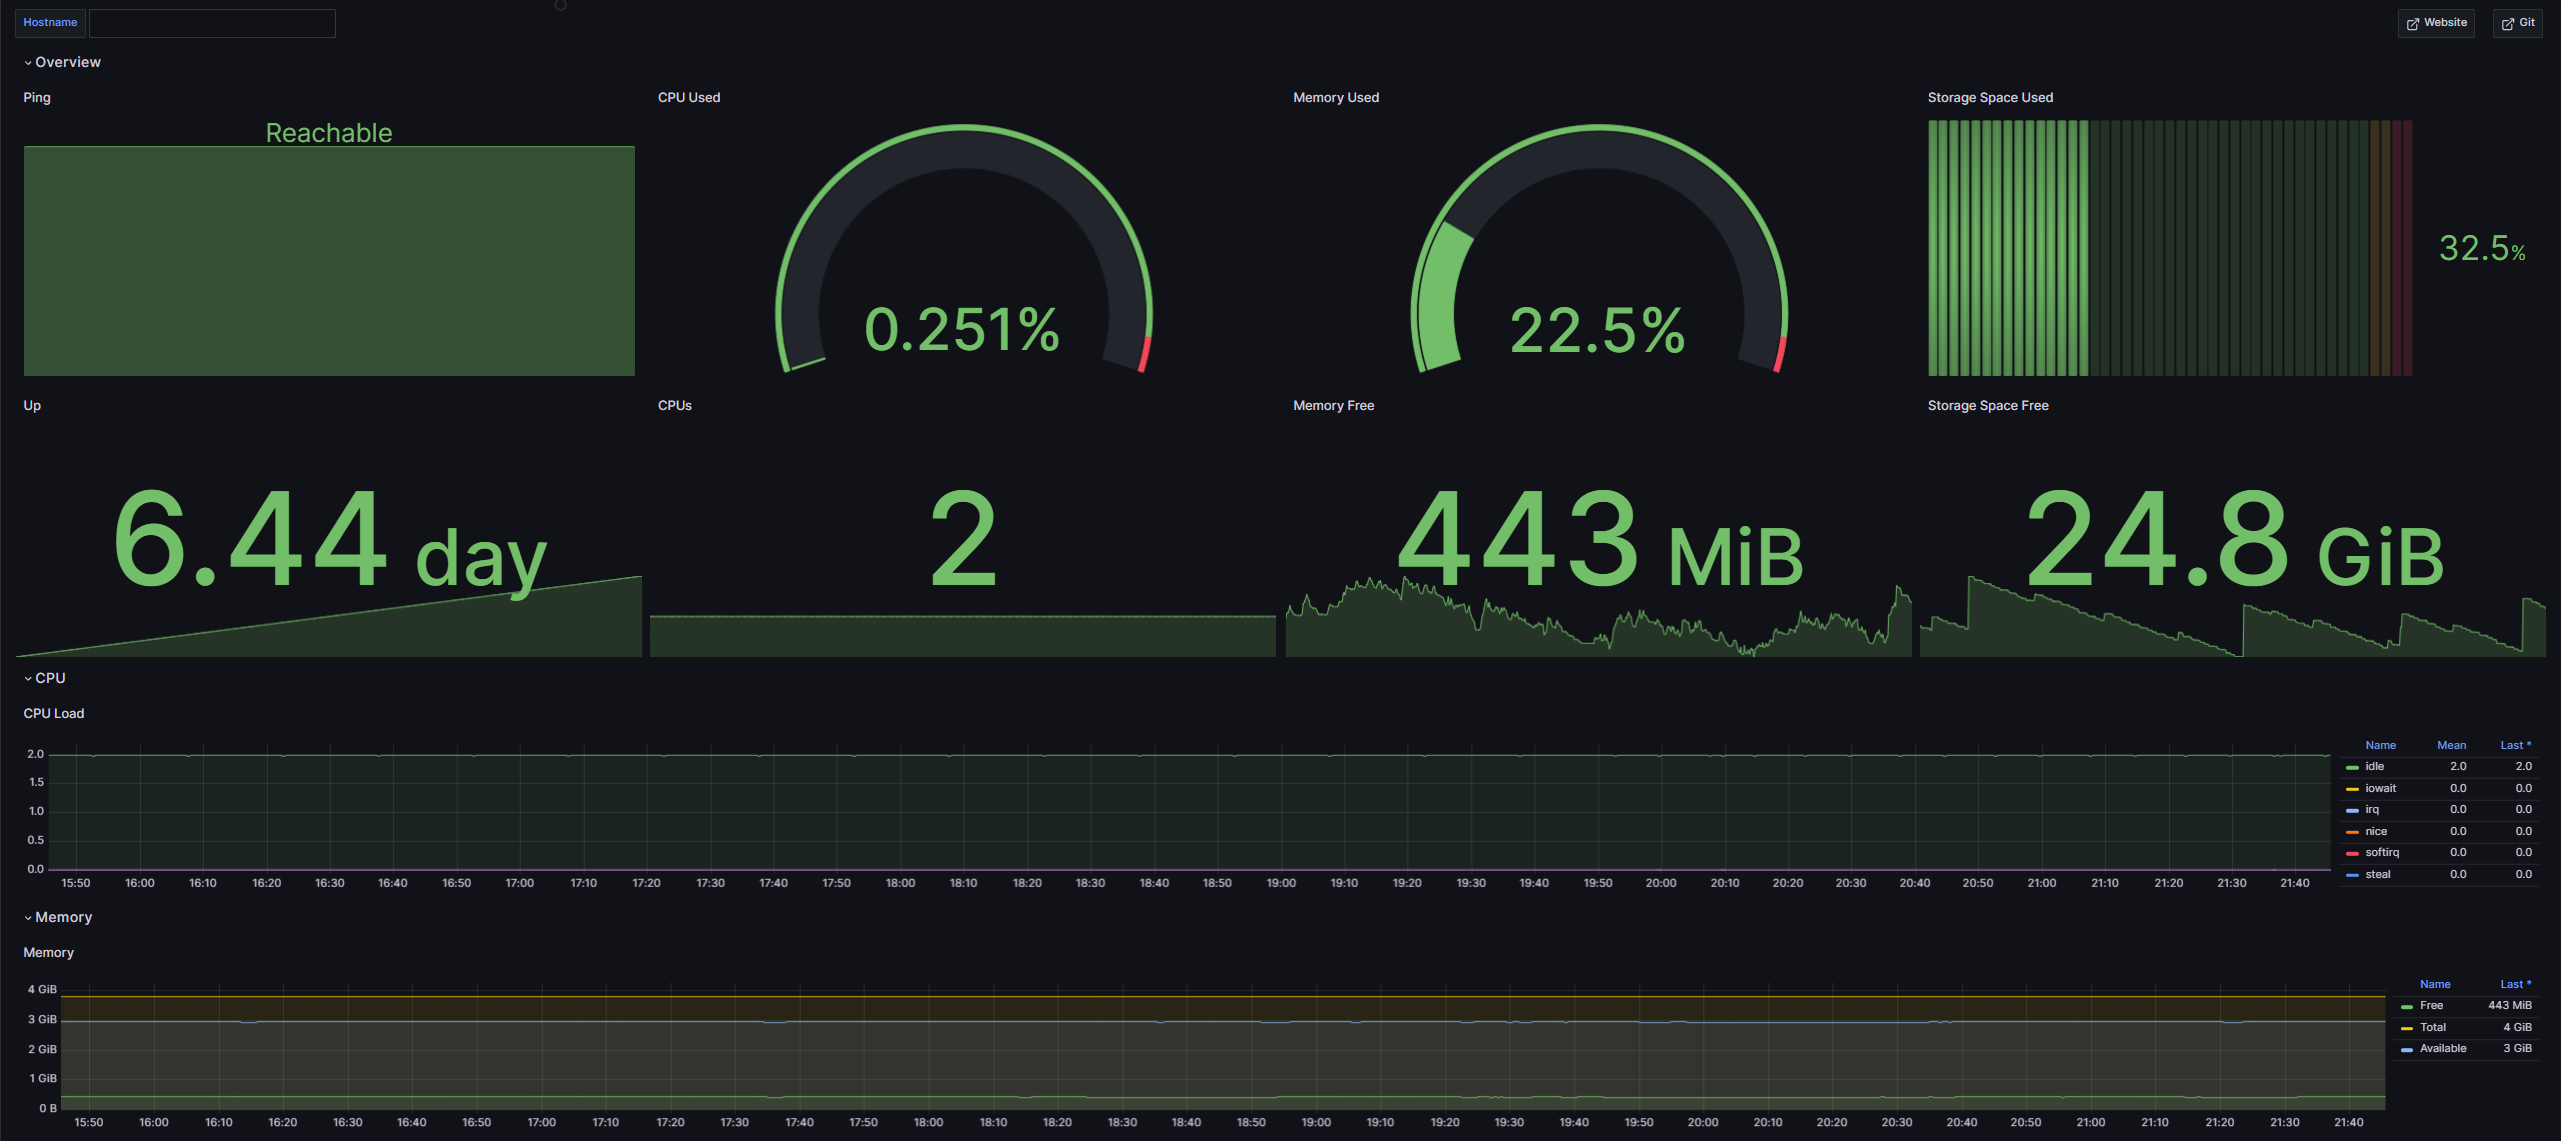
Once you import the Linux Server Overview Dashboard, it should appear as shown (please note that some data has been blacked out in the images for privacy reasons). In this dashboard, you can see the current metrics of your Linux server:
- Ping (Is the server up?)
- Up (Since when has the server been running?)
- CPU Used (How much of the CPU is currently used in percent)
- CPUs (How many CPUs does your server have?)
- Memory Used (How much memory is used in percent)
- Memory Free (How much memory is free in bytes)
- Storage Space Used (How much storage is used in percent)
- Storage Space Free (How much storage is free in bytes)
You can also see how some metrics have changed over time:
- CPU Load (How has the CPU load changed over time?)
- Memory (How has the free memory changed over time?)
- Disk Free (How has the free disk space changed over time?)
You can find more information here: Git
Data source config
Collector type:
Collector plugins:
Collector config:
Revisions
Upload an updated version of an exported dashboard.json file from Grafana
| Revision | Description | Created | |
|---|---|---|---|
| Download |
Linux Server
Monitor Linux with Grafana. Easily monitor your Linux deployment with Grafana Cloud's out-of-the-box monitoring solution.
Learn more