ASP.NET Core
ASP.NET Core metrics from OpenTelemetry
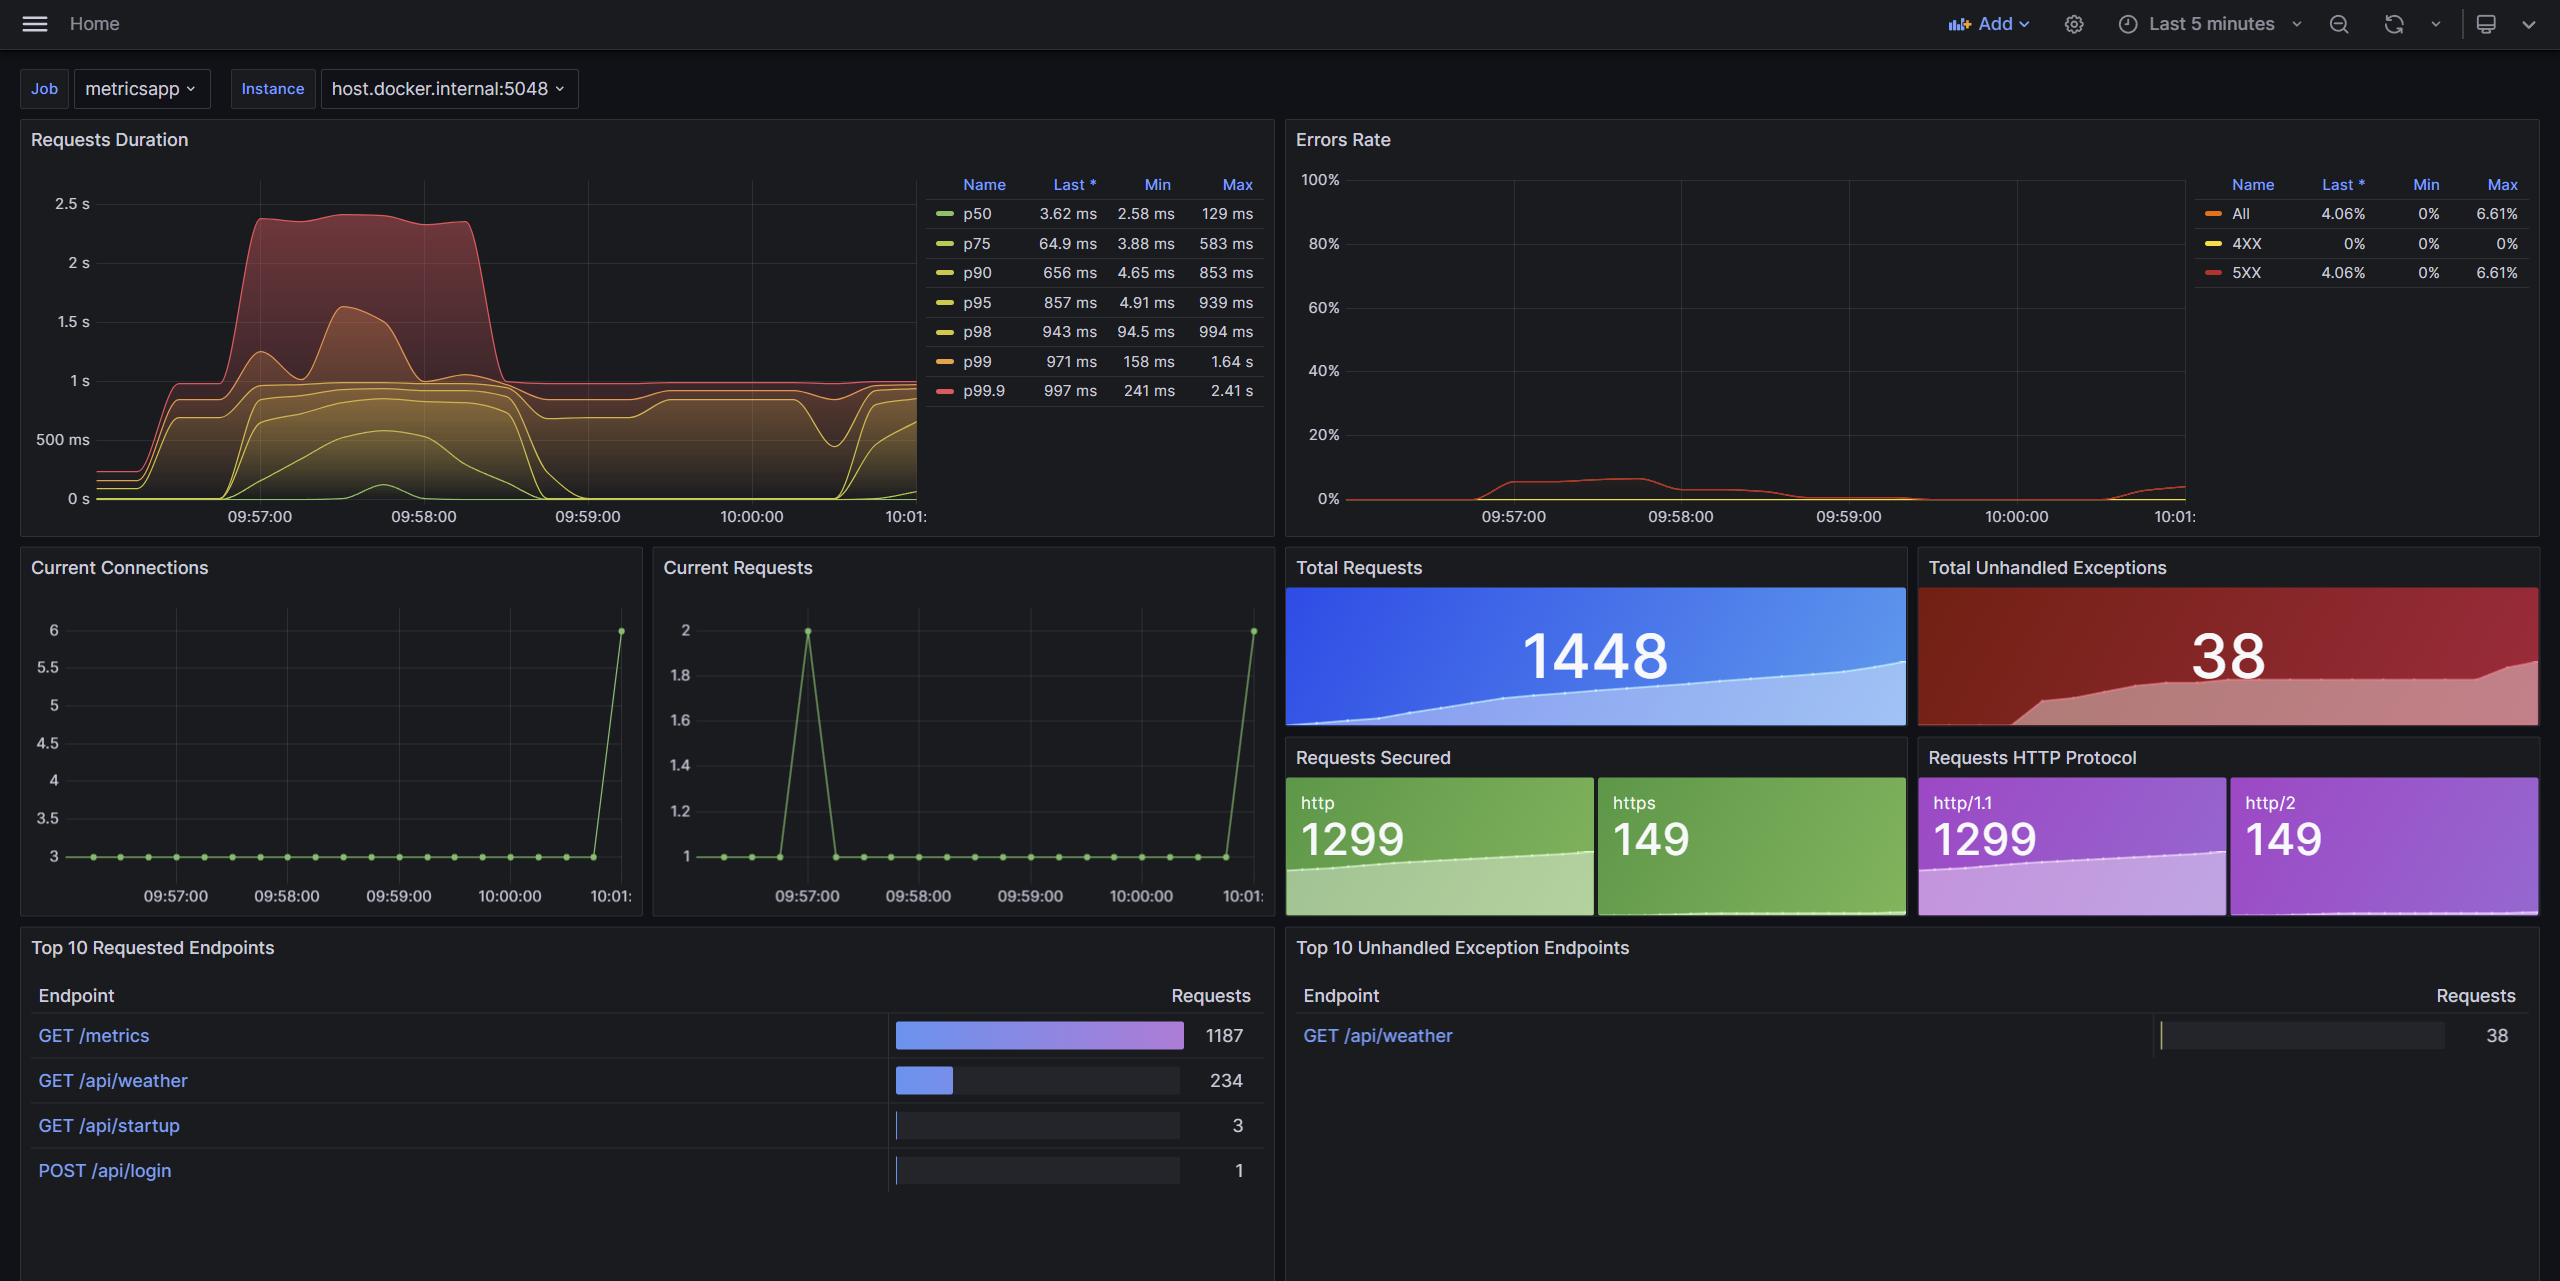
Understand the state of an ASP.NET Core app at a glance with the ASP.NET Core dashboard. This dashboard includes the most commonly used ASP.NET Core metrics.
Requires .NET 8 or later.
Data displayed:
- Request duration
- Error rate
- Current connections
- Current requests
- Total requests
- Total unhandled exceptions
- Requests secured
- Requests HTTP protocol
- Top requested endpoints
- Top errored endpoints
The endpoints in this dashboard link to the ASP.NET Core endpoint dashboard. The endpoint dashboard provides more detail about individual endpoints. Import both dashboards into Grafana for the best experience.
Data source config
Collector type:
Collector plugins:
Collector config:
Revisions
Upload an updated version of an exported dashboard.json file from Grafana
| Revision | Description | Created | |
|---|---|---|---|
| Download |