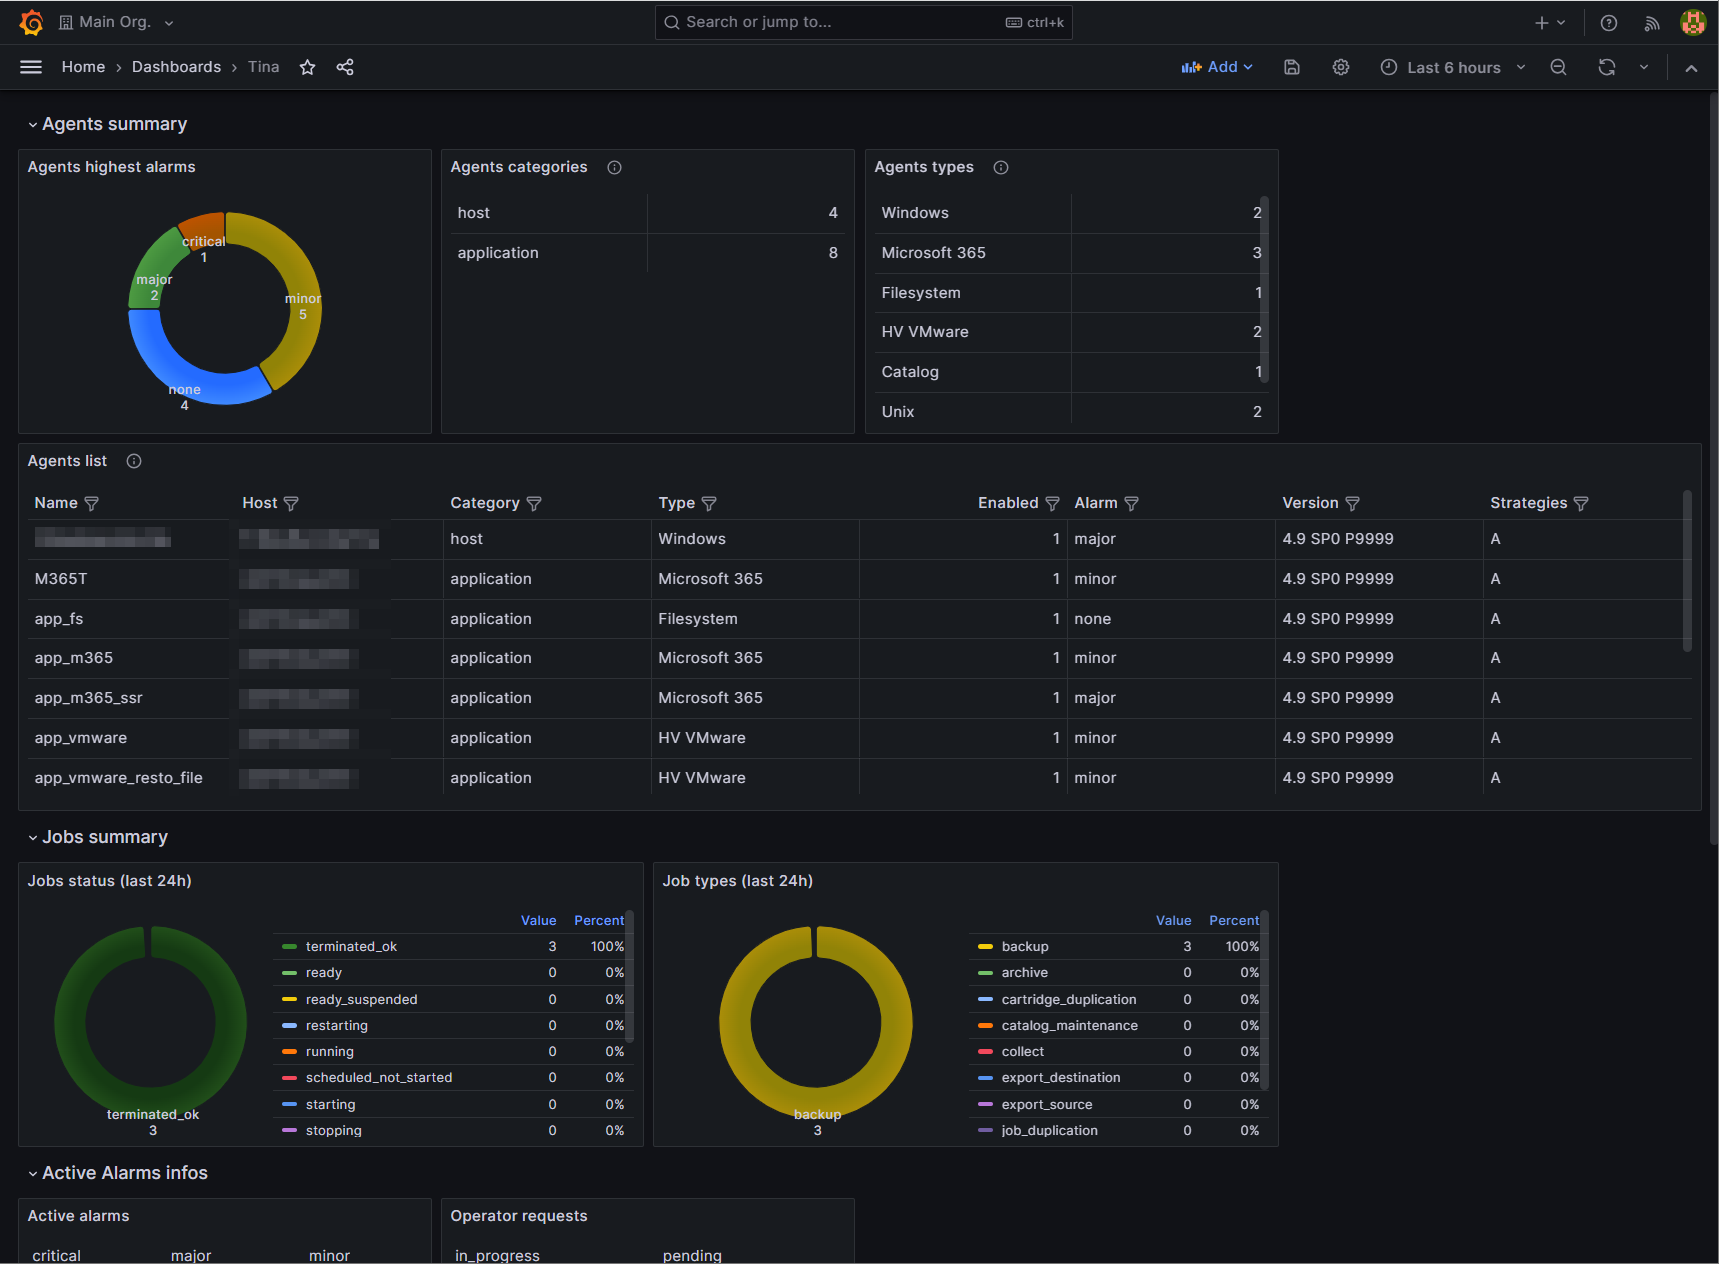
Atempo Tina
Dashboard for Atempo Tina Data Protection
Prerequisites
This dashboard requires :
- Tina server version 4.9 or superior
- Prometheus for scraping
Enable OpenMetrics endpoint
Open Tina webUI then navigate to Settings -> Preferences. Edit Application Parameters.
Activate metrics endpoint then check Enable trusted IP address. Enter the IP address of your Prometheus scraper server.
Click Save to enable your configuration.
Example of Prometheus configuration
This is an example of Prometheus configuration to scrape Tina metrics
Extract of scrape_configs section of prometheus.yml configuration file :
  - job_name: 'catalog@tina-server.yourdomain.com'
    scrape_interval: 5m
    scrape_timeout: 1m
    params:
      catalog: ['catalog']
      server: ['tina-server']
    metrics_path: /Tina/api/metrics
    scheme: https
    tls_config:
      insecure_skip_verify: true
    static_configs:
      - targets: ['tina-server.yourdomain.com:25088']
Replace catalog with Tina catalog name and tina-server with Tina hostname as configured in the application. If you have multiple catalogs, you must create one scrape config per catalog.
Replace tina-server.yourdomain.com:25088 with hostname and administration port of your Tina server.
Warning : Depending on your config, "metrics_path" URL may not start with an upper case "T".
Note: Parameter insecure_skip_verify: true is only required if your Tina server certificate is not valid (self-signed or unknown authority).
Import dashboard
Import the current dashboard into Grafana.
Data source config
Collector config:
Upload an updated version of an exported dashboard.json file from Grafana
| Revision | Description | Created | |
|---|---|---|---|
| Download |