Azure / SCOM Managed Instance / Operational Dashboard
Operational dashboard for summary of alerts, heath and performance of monitored resources connected to SCOM managed instance.
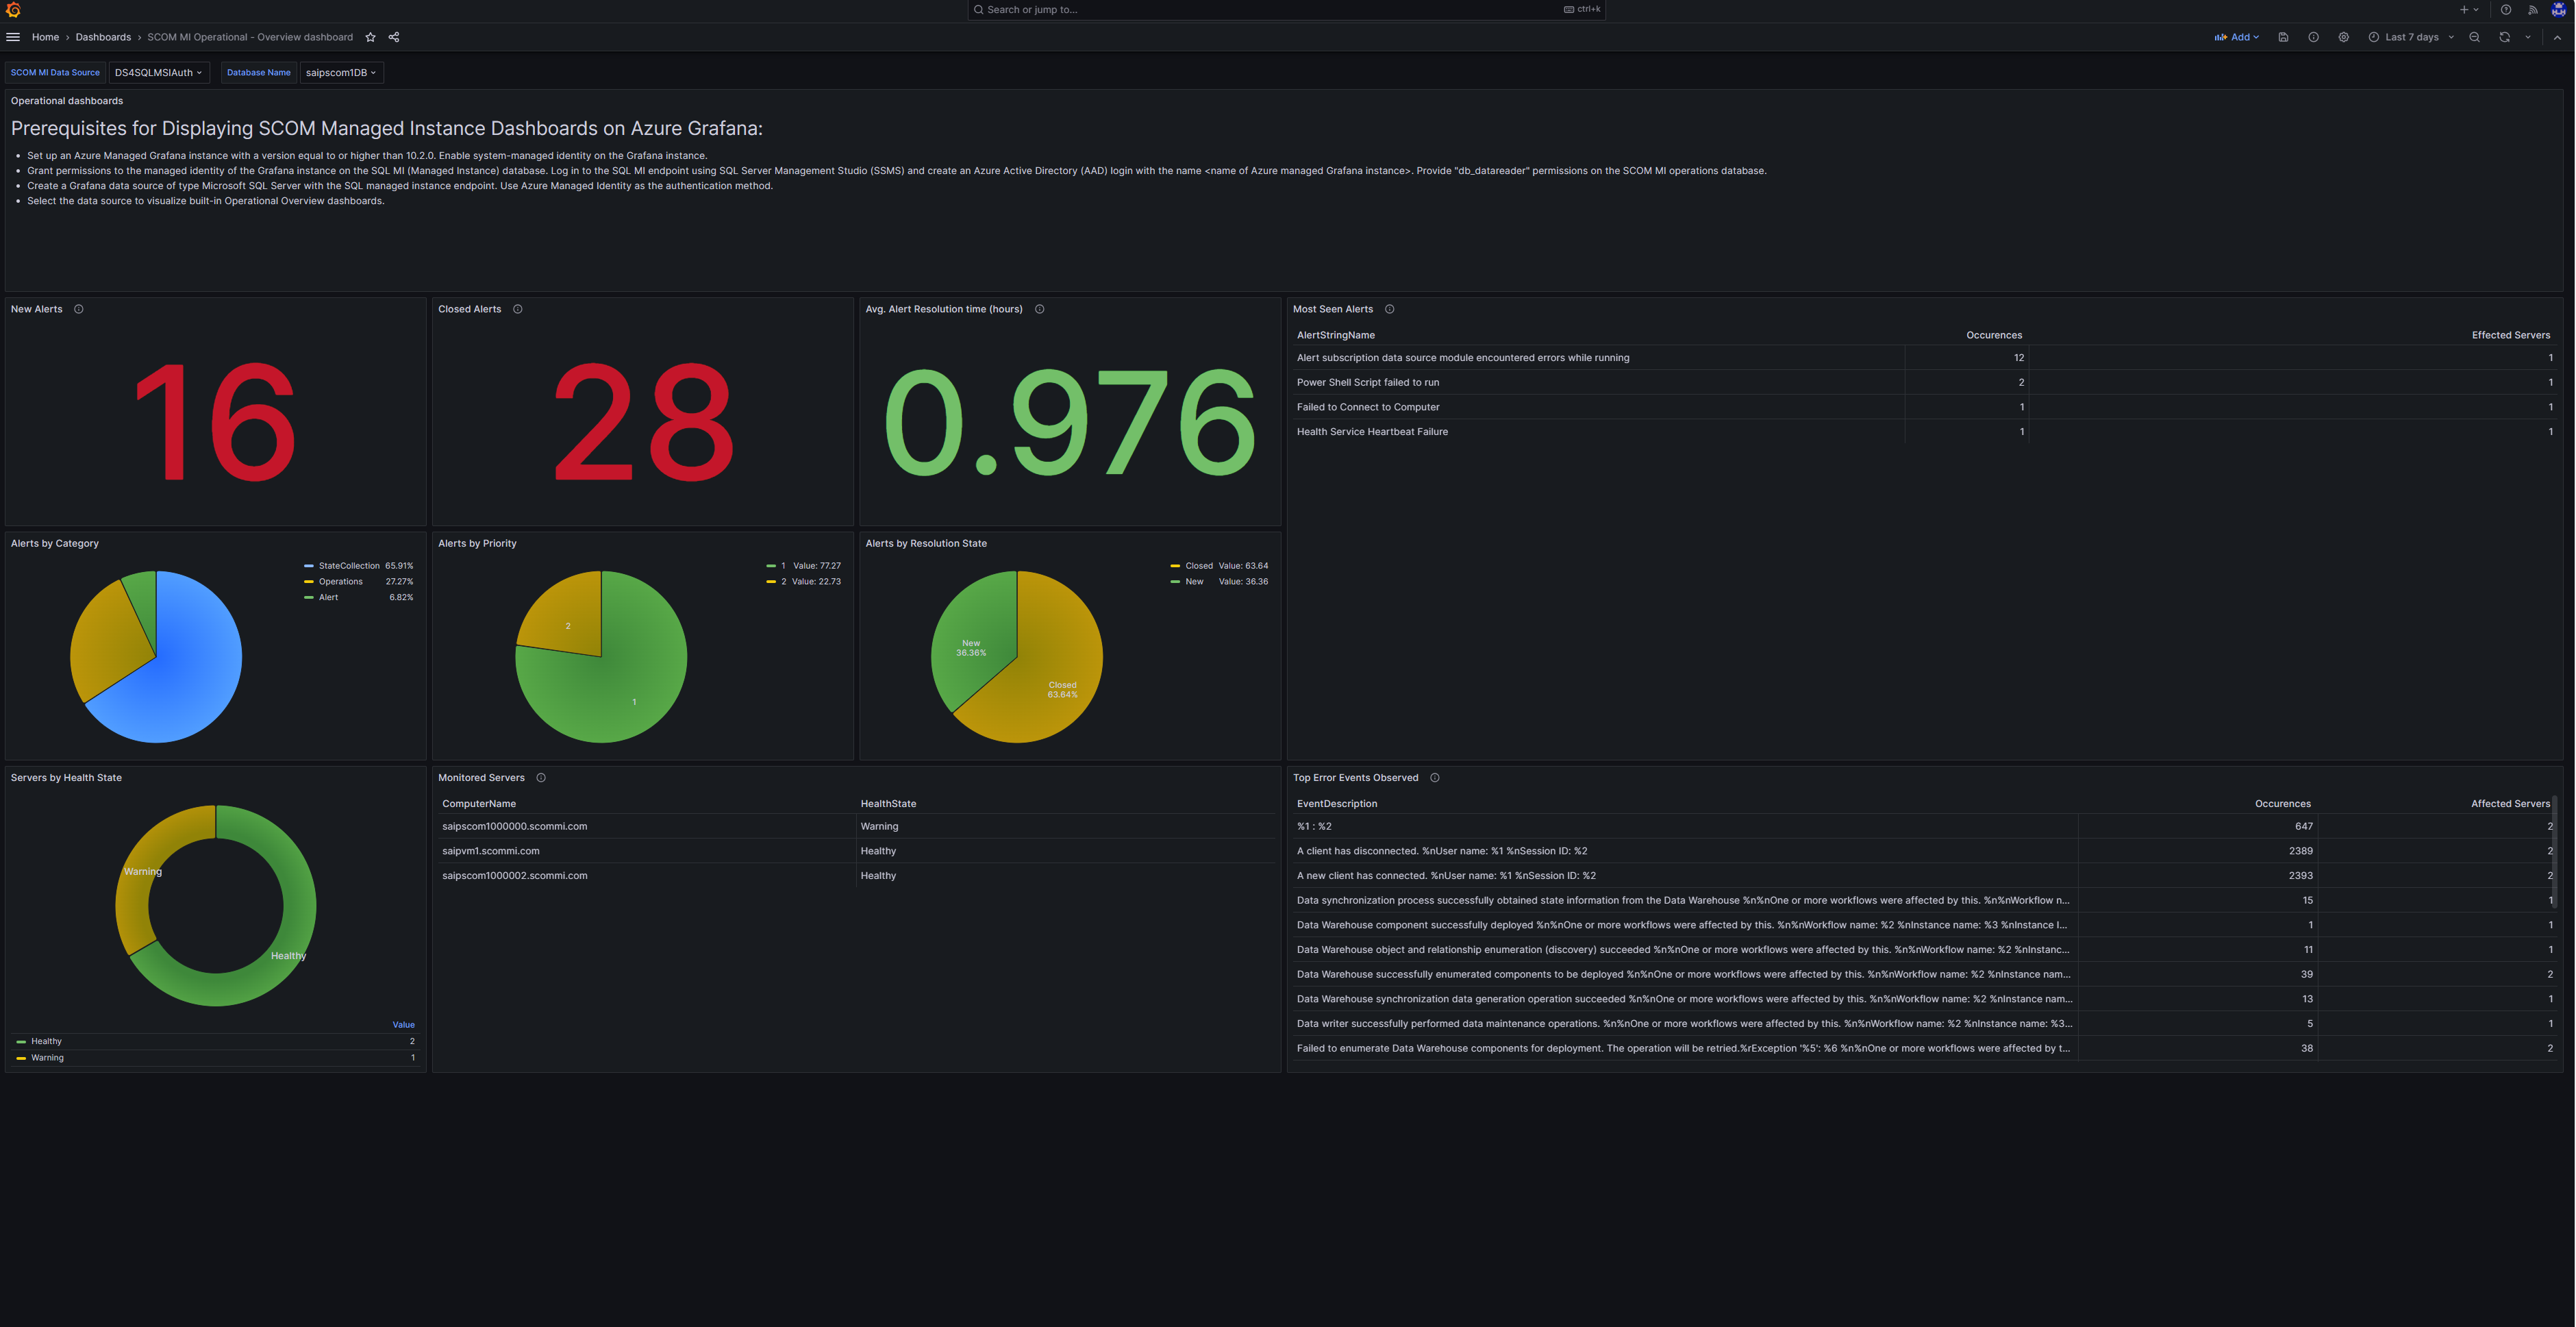
The Azure / SCOM Managed Instance / Operational Dashboard dashboard uses the data source to create a Grafana dashboard with the panel.
Data source config
Collector type:
Collector plugins:
Collector config:
Revisions
Upload an updated version of an exported dashboard.json file from Grafana
| Revision | Description | Created | |
|---|---|---|---|
| Download |
Azure Cosmos DB
With the Grafana plugin for Azure Cosmos DB, you can quickly visualize and query your Azure Cosmos DB data from within Grafana.
Learn more