Vertica Overview (Prometheus)
General cluster overview.
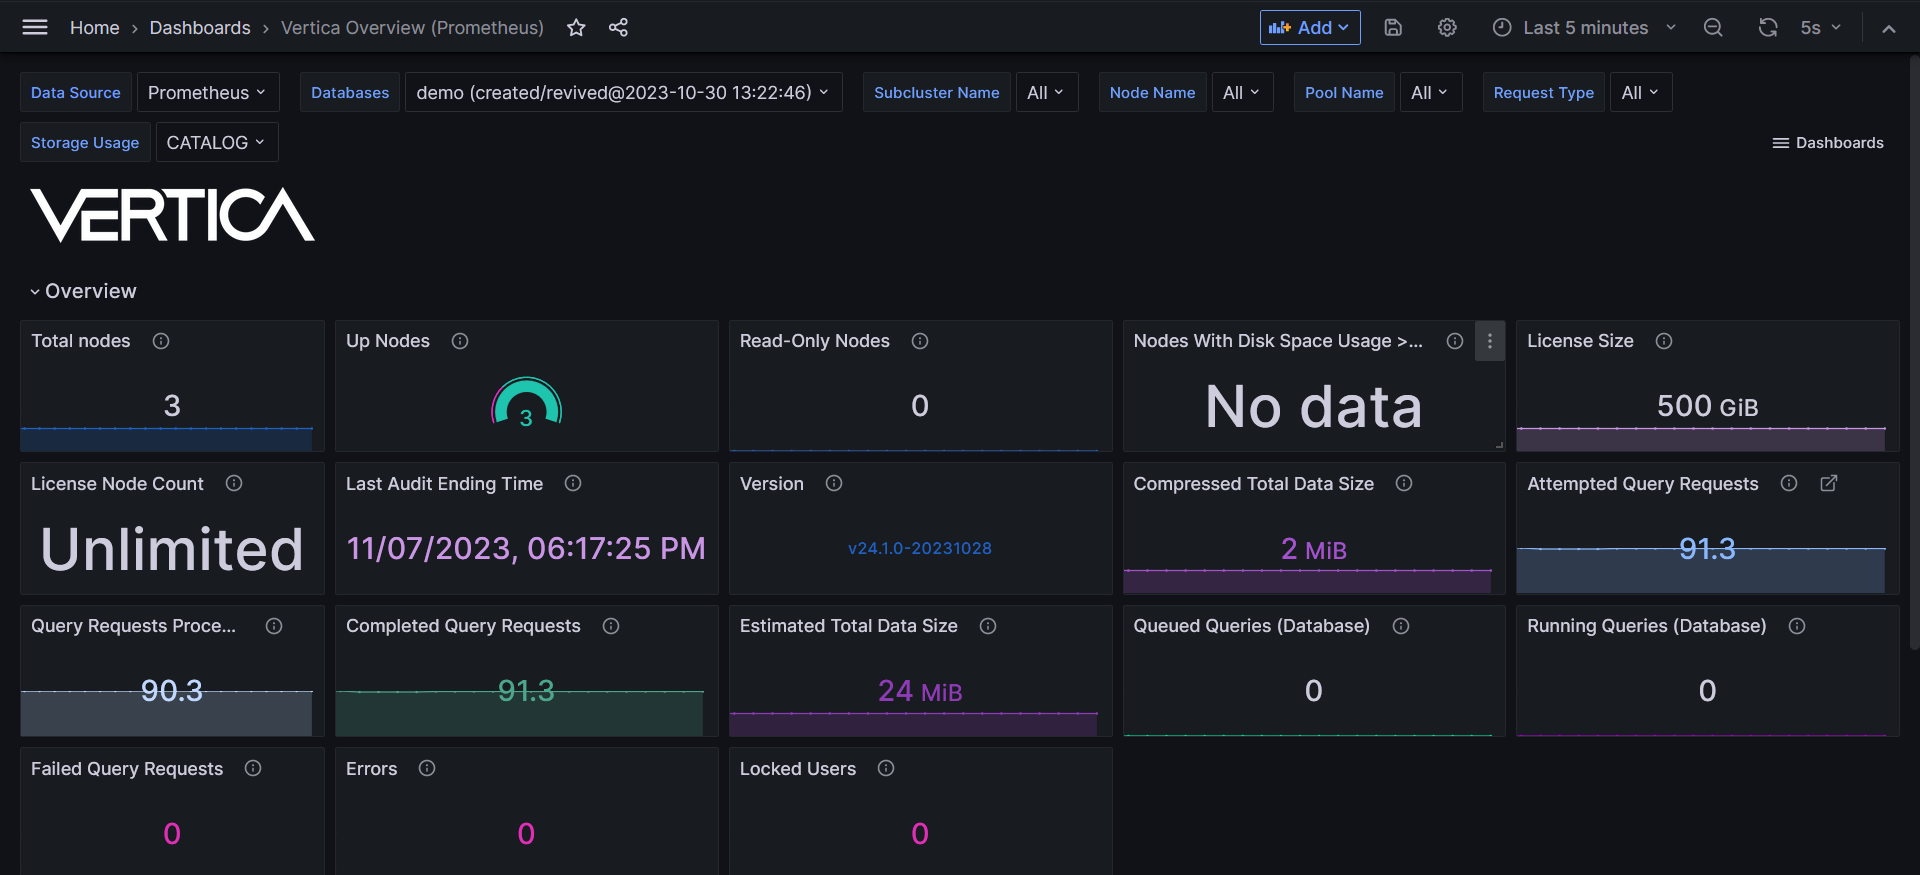
View the overall state of your cluster. This dashboard is designed to be the landing page for Vertica Grafana dashboards.
This dashboard visualizes the following data:
- Total number of nodes and their state, data size, and disk usage
- Query request and processing statistics
- Number of errors
- User and license information
- Overall cluster health
IMPORTANT: To access Prometheus metrics, Vertica requires that you configure the HTTPS service for certificate authentication.
Vertica dashboards
Vertica recommends running Vertica Overview (Prometheus) with other Vertica dashboards that use Prometheus as a data source:
Additional resources
These resources provide details about Vertica and Prometheus:
- Prometheus metrics: comprehensive list of Prometheus metrics that Vertica supports.
- vertica/vertica-kubernetes: Vertica on Kubernetes GitHub repository.
- Prometheus integration: configure Vertica on Kubernetes with Prometheus.
Available on GitHub.
Data source config
Collector type:
Collector plugins:
Collector config:
Revisions
Upload an updated version of an exported dashboard.json file from Grafana
| Revision | Description | Created | |
|---|---|---|---|
| Download |