Vertica Resource Management (Prometheus)
Monitors resource pool usage.
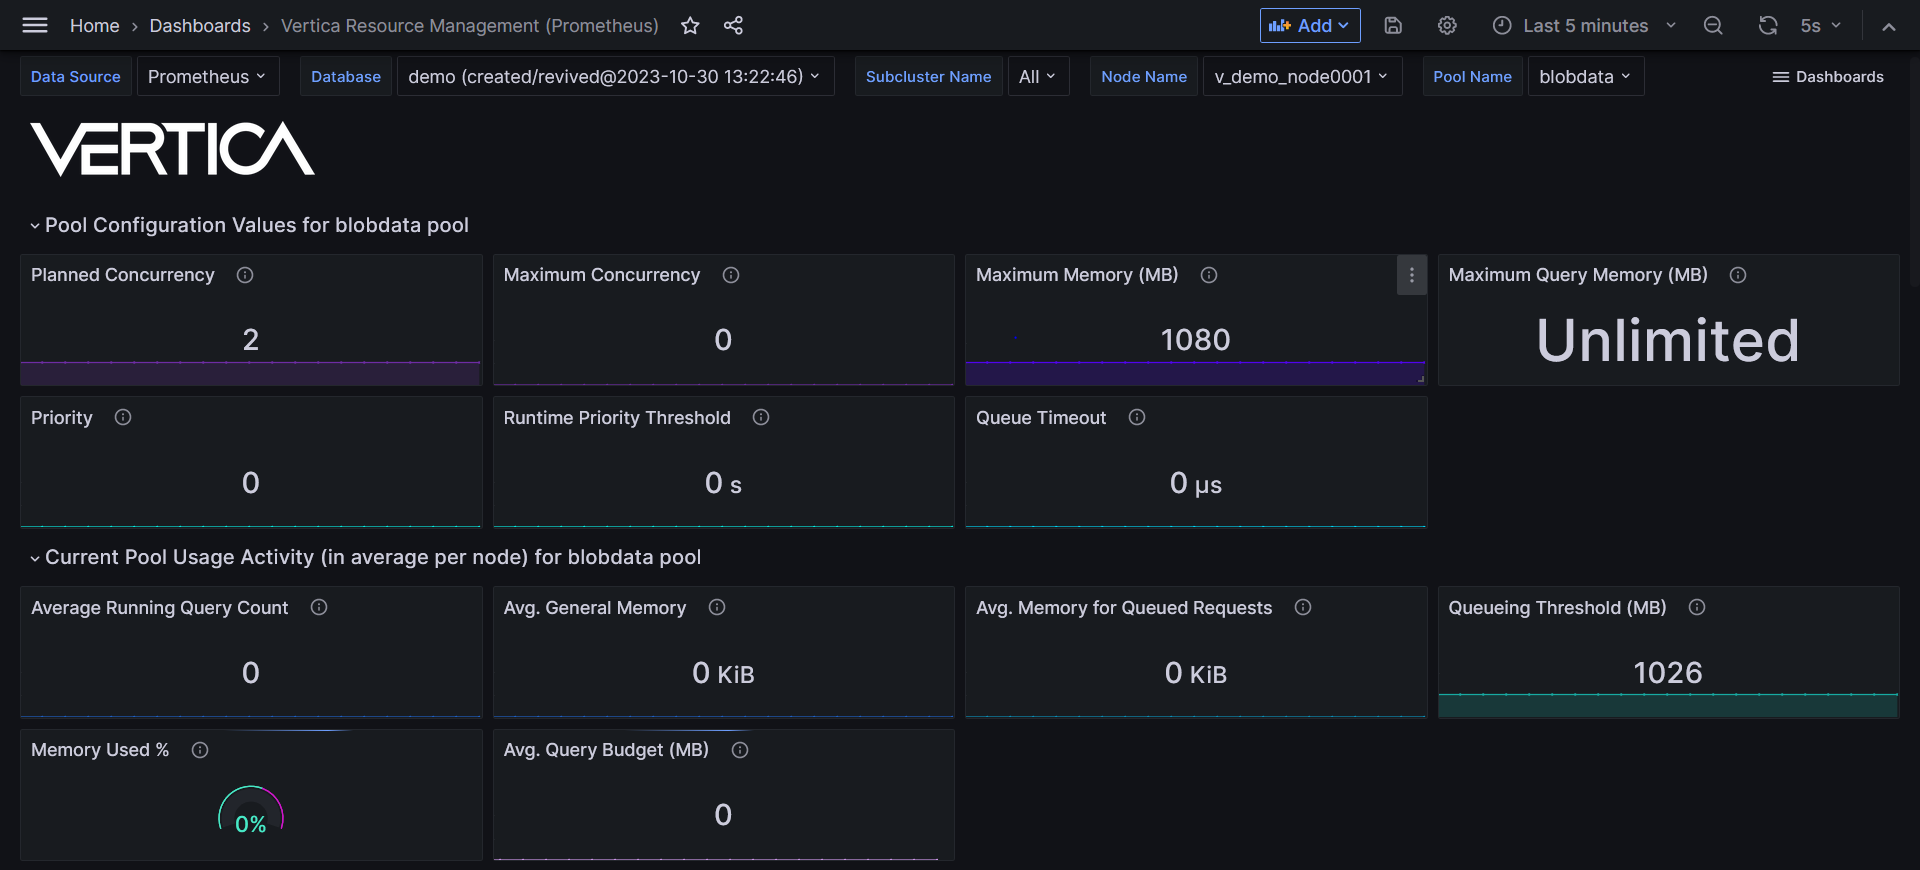
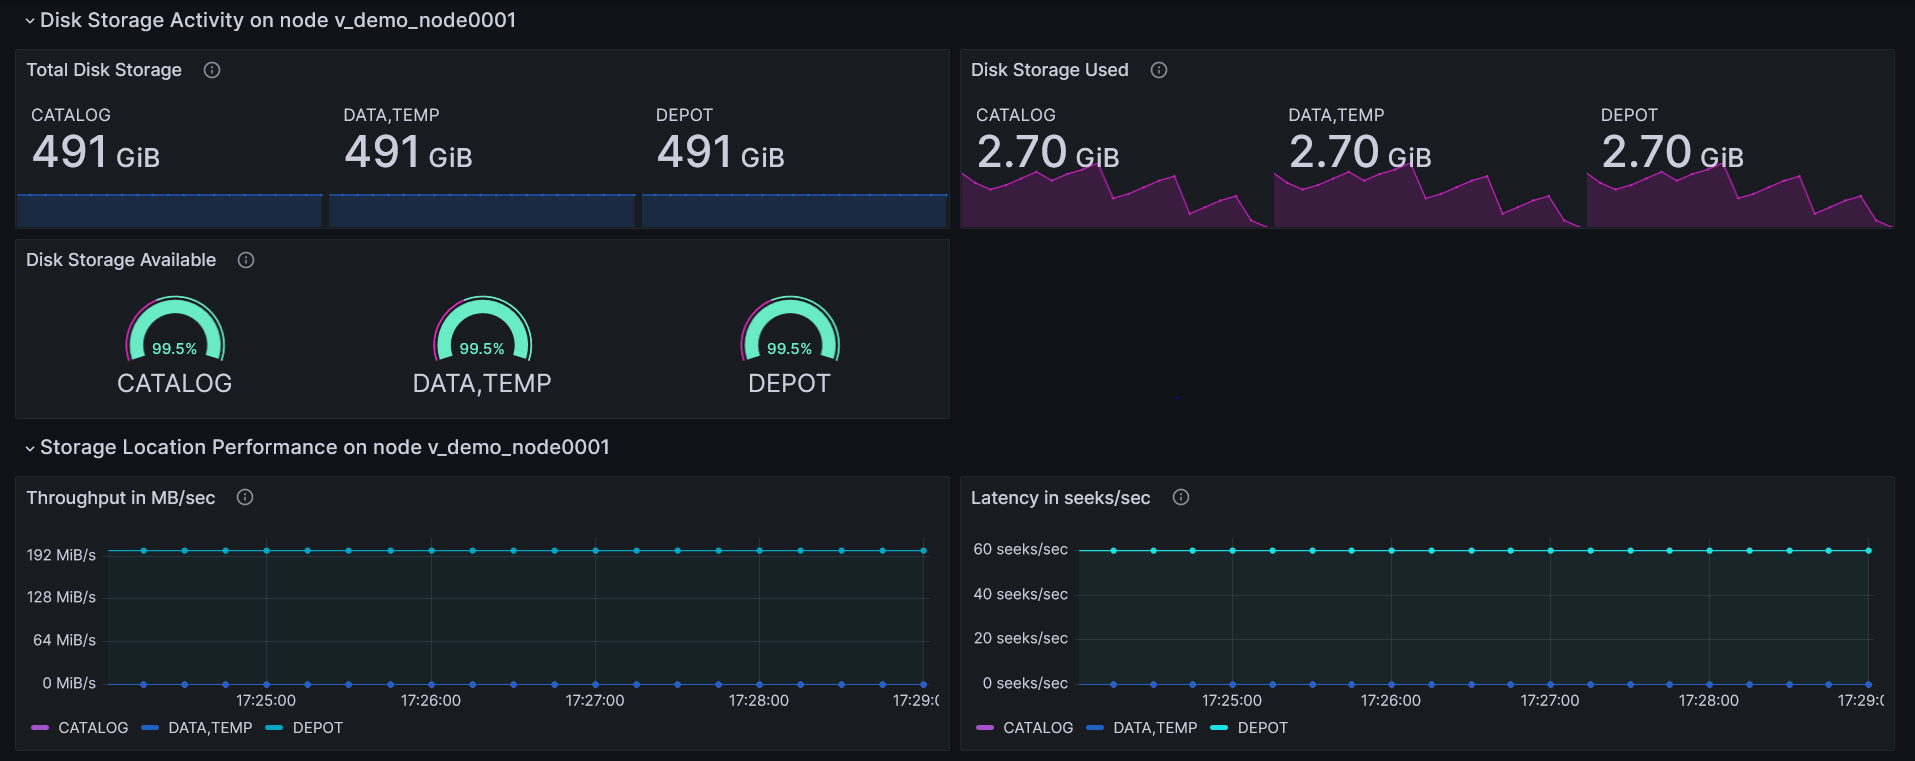
View details about user-defined and built-in resource pool usage. This dashboard visualizes the following data:
- Pool configuration values
- Per node pool usage activity and statistics
- Per node disk storage state
- Per node storage location performance
IMPORTANT: To access Prometheus metrics, Vertica requires that you configure the HTTPS service for certificate authentication.
Vertica dashboards
Vertica recommends running Vertica Resource Management (Prometheus) with other Vertica dashboards that use Prometheus as a data source:
Additional resources
These resources provide details about Vertica and Prometheus:
- Prometheus metrics: comprehensive list of Prometheus metrics that Vertica supports.
- vertica/vertica-kubernetes: Vertica on Kubernetes GitHub repository.
- Prometheus integration: configure Vertica on Kubernetes with Prometheus.
Available on GitHub.
Data source config
Collector type:
Collector plugins:
Collector config:
Revisions
Upload an updated version of an exported dashboard.json file from Grafana
| Revision | Description | Created | |
|---|---|---|---|
| Download |