cAdvisor Docker Insights
This Grafana dashboard offers a basic overview of key performance metrics for Docker containers in your system.
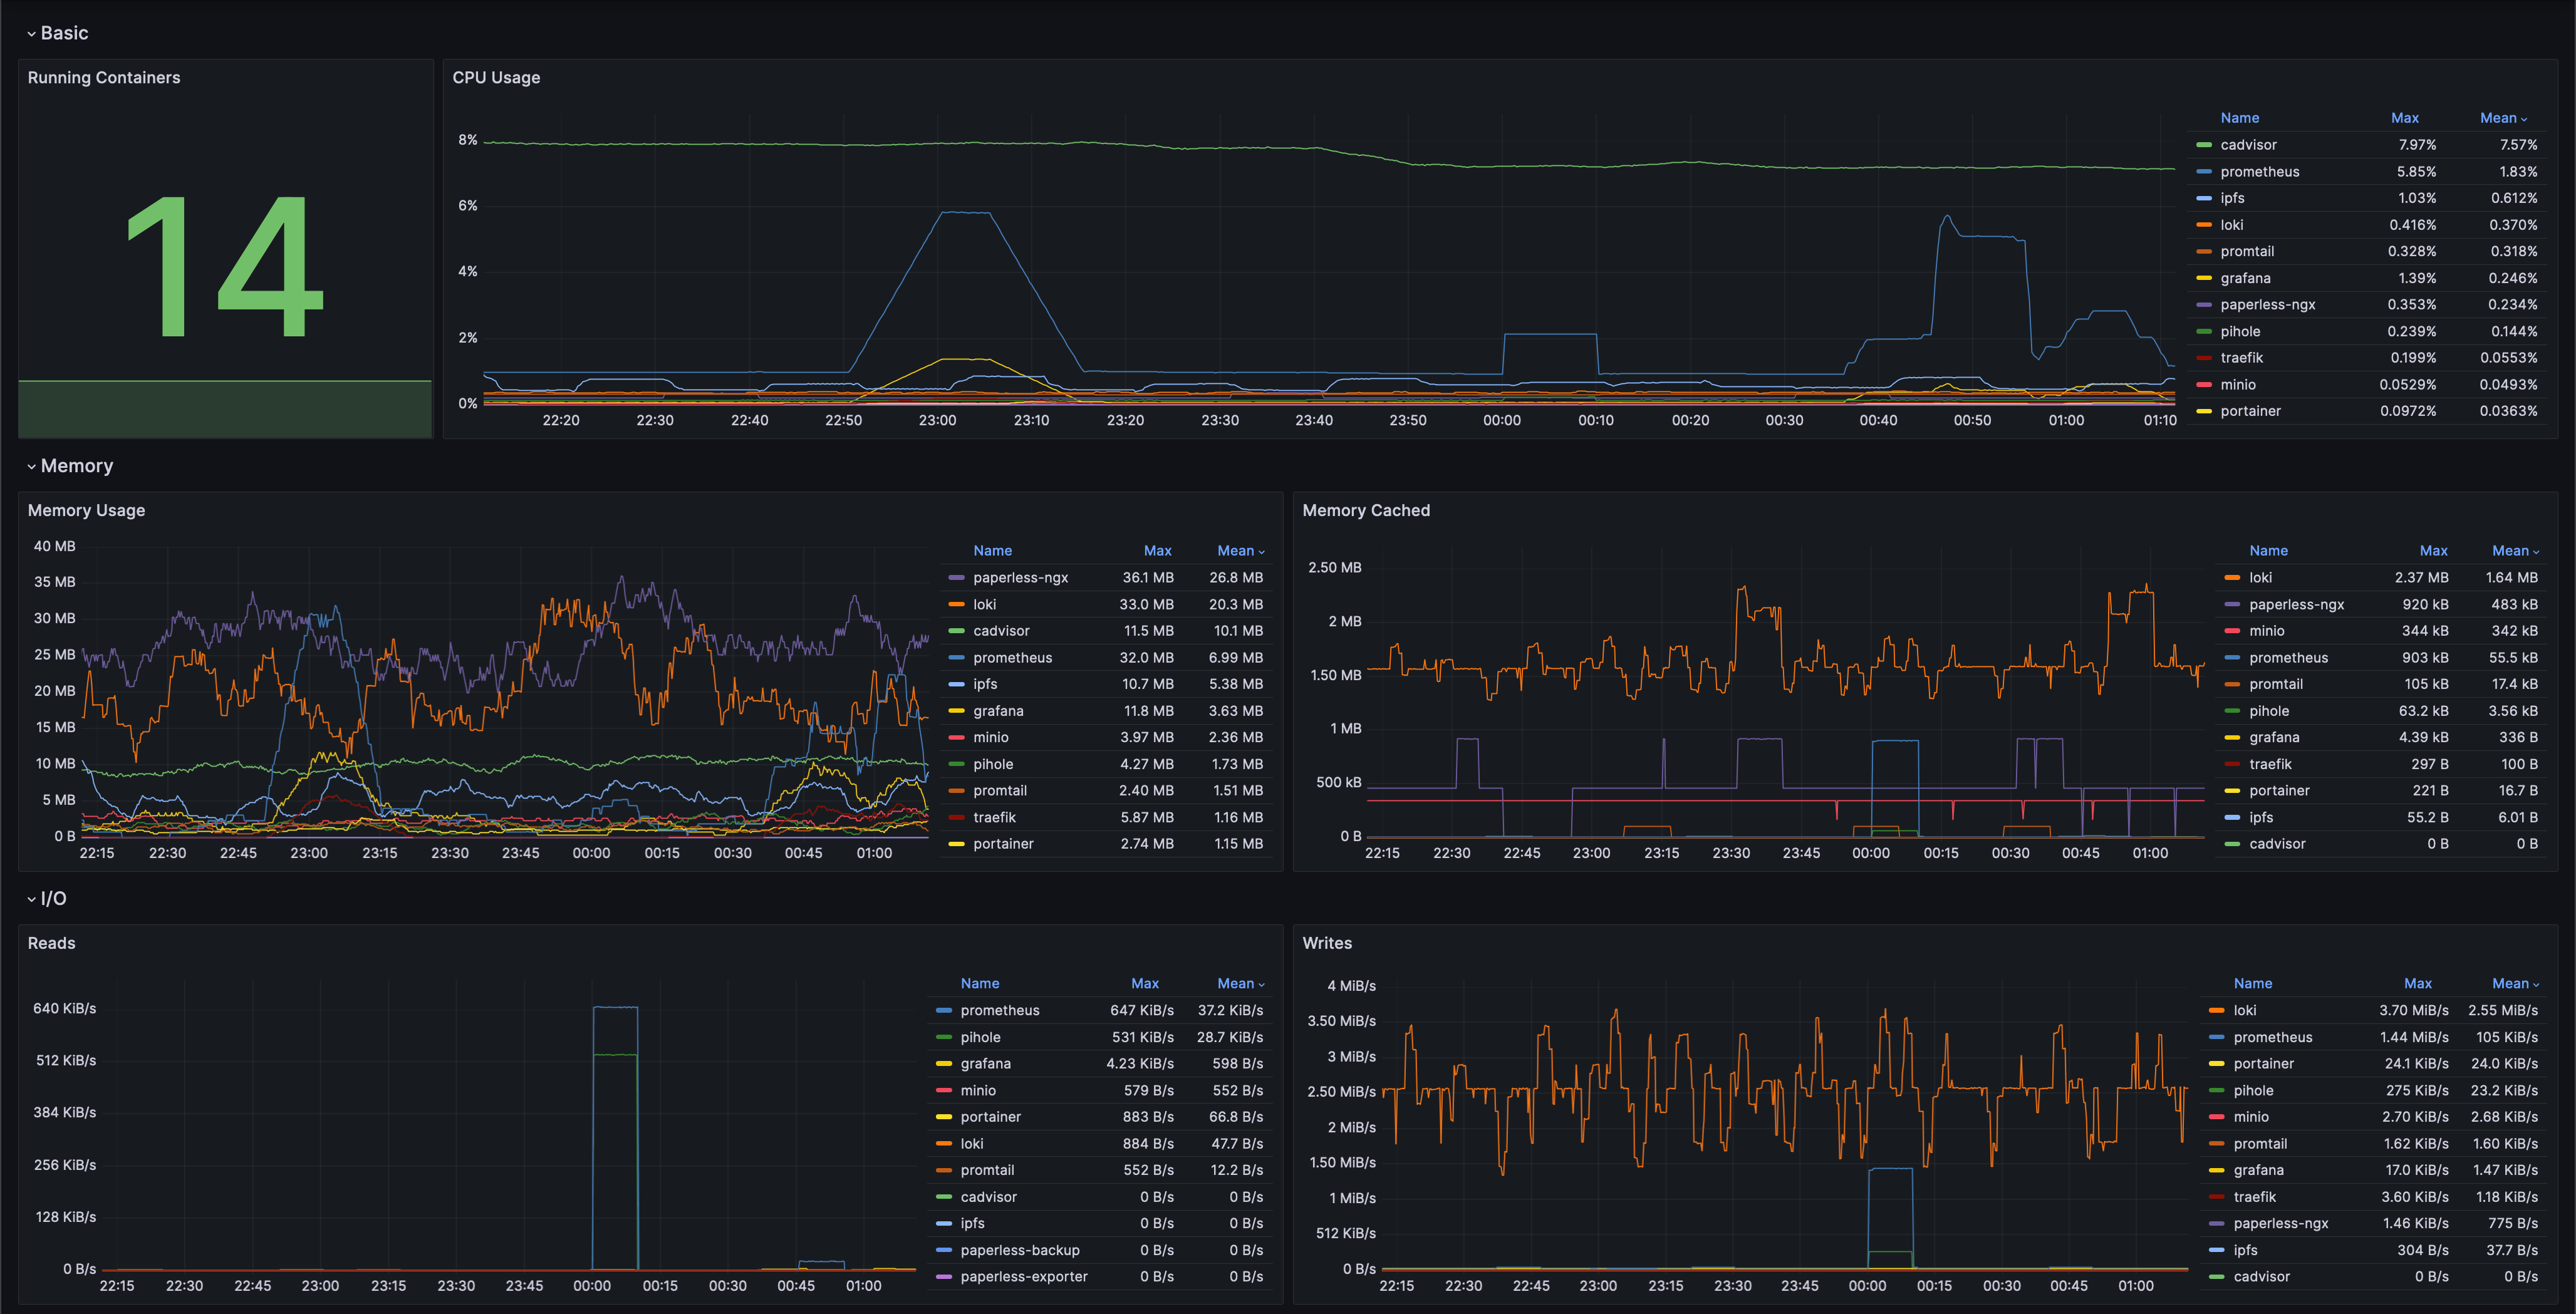
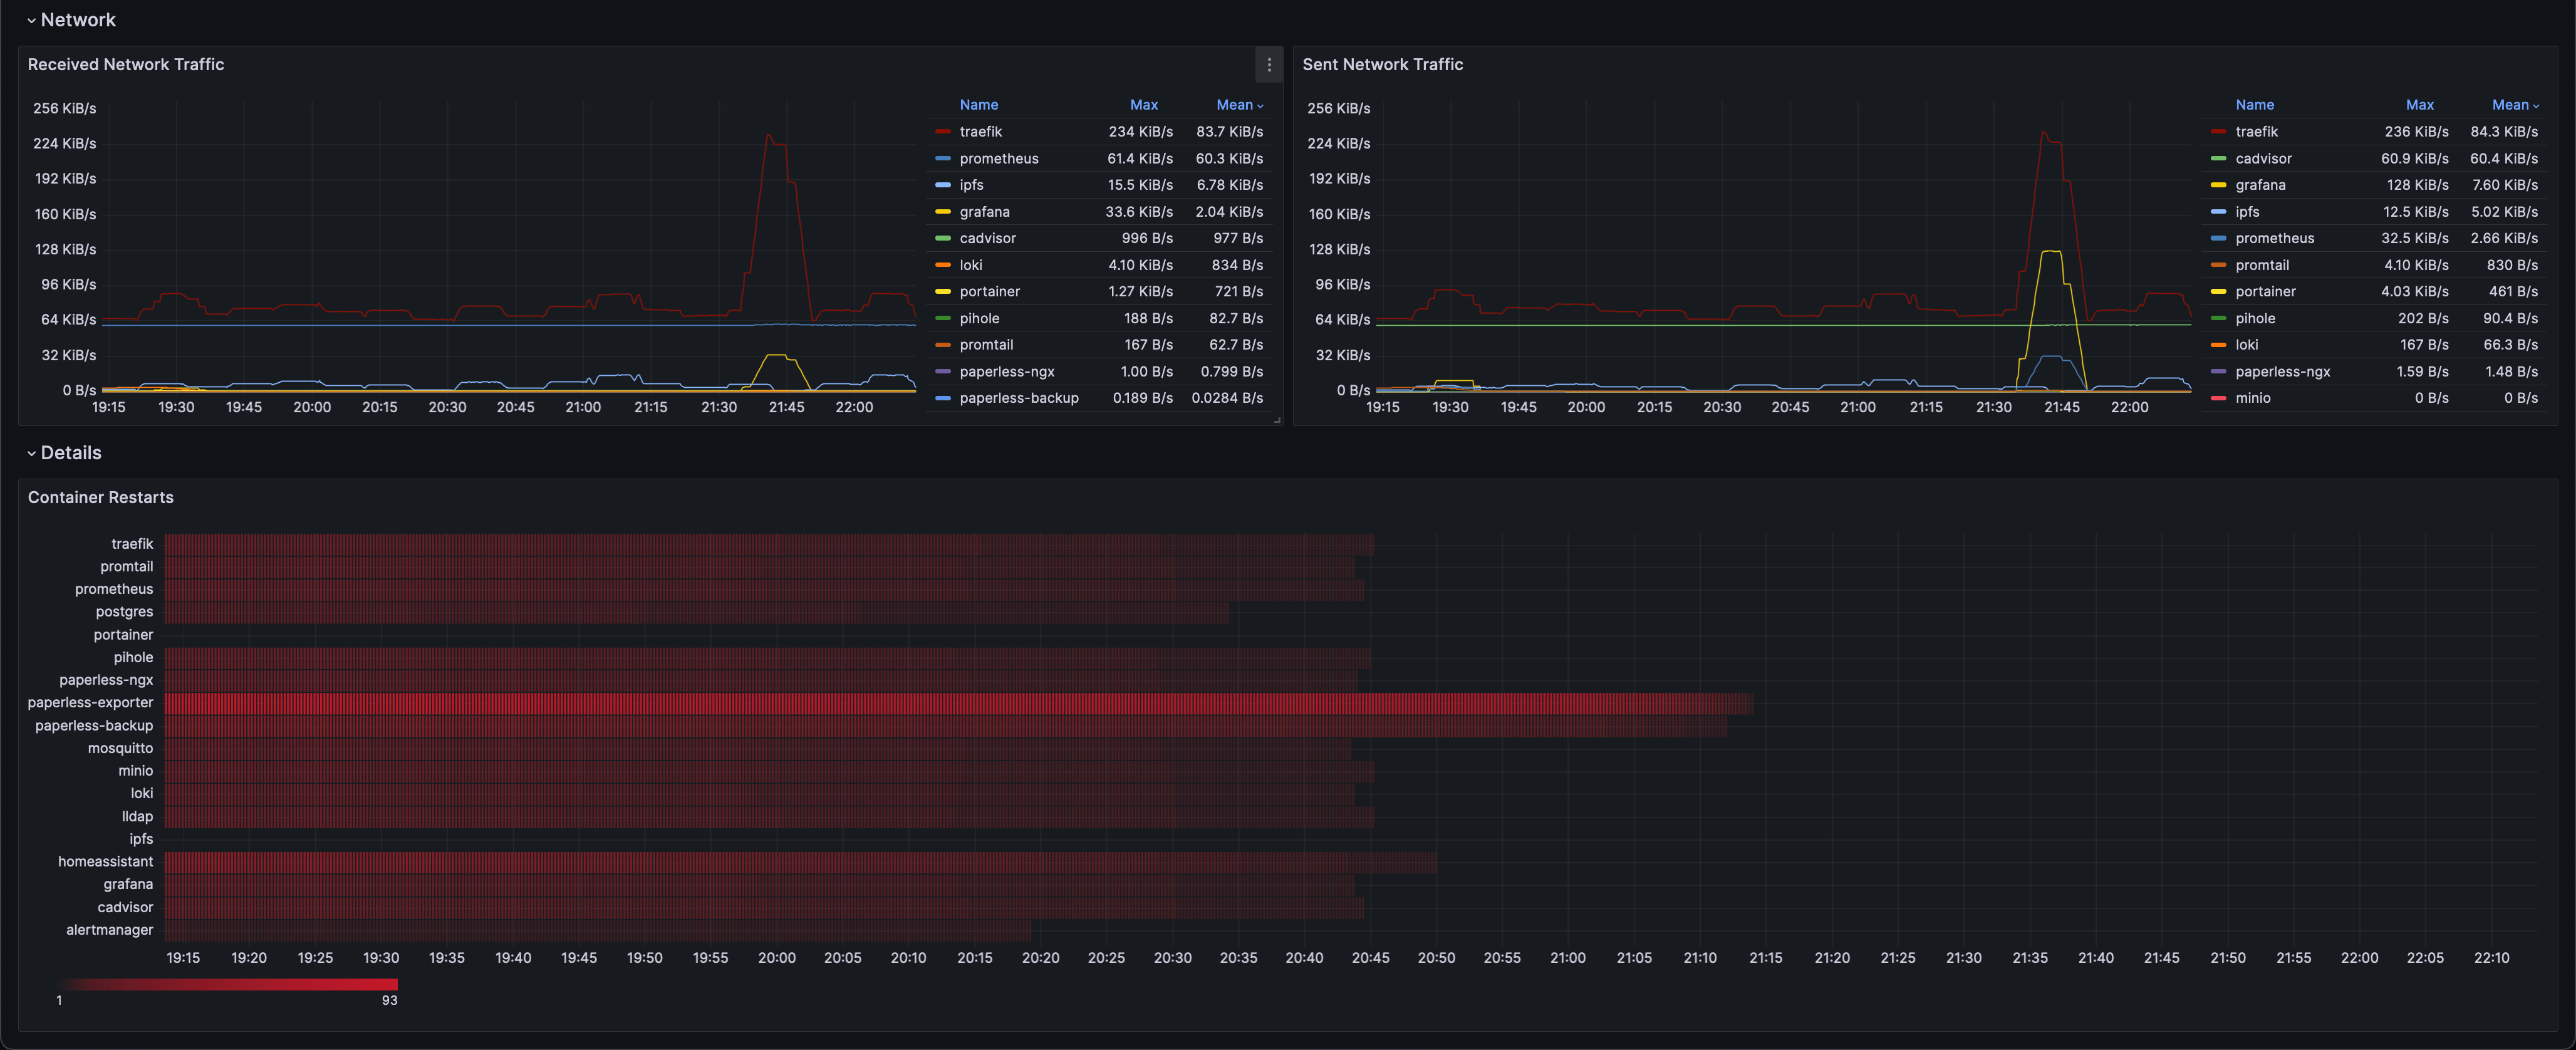
This Grafana dashboard offers a basic overview of key performance metrics for Docker containers in your system. By utilizing Prometheus for data collection and cAdvisor for container-specific insights, it provides a clear view of CPU, memory, I/O, and container restarts, allowing you to monitor and manage your containerized environment effectively.
Data source config
Collector type:
Collector plugins:
Collector config:
Revisions
Upload an updated version of an exported dashboard.json file from Grafana
| Revision | Description | Created | |
|---|---|---|---|
| Download |
Docker
Easily monitor Docker with Grafana Cloud's out-of-the-box monitoring solution.
Learn more