ASP.NET OTEL Metrics from OTEL Collector
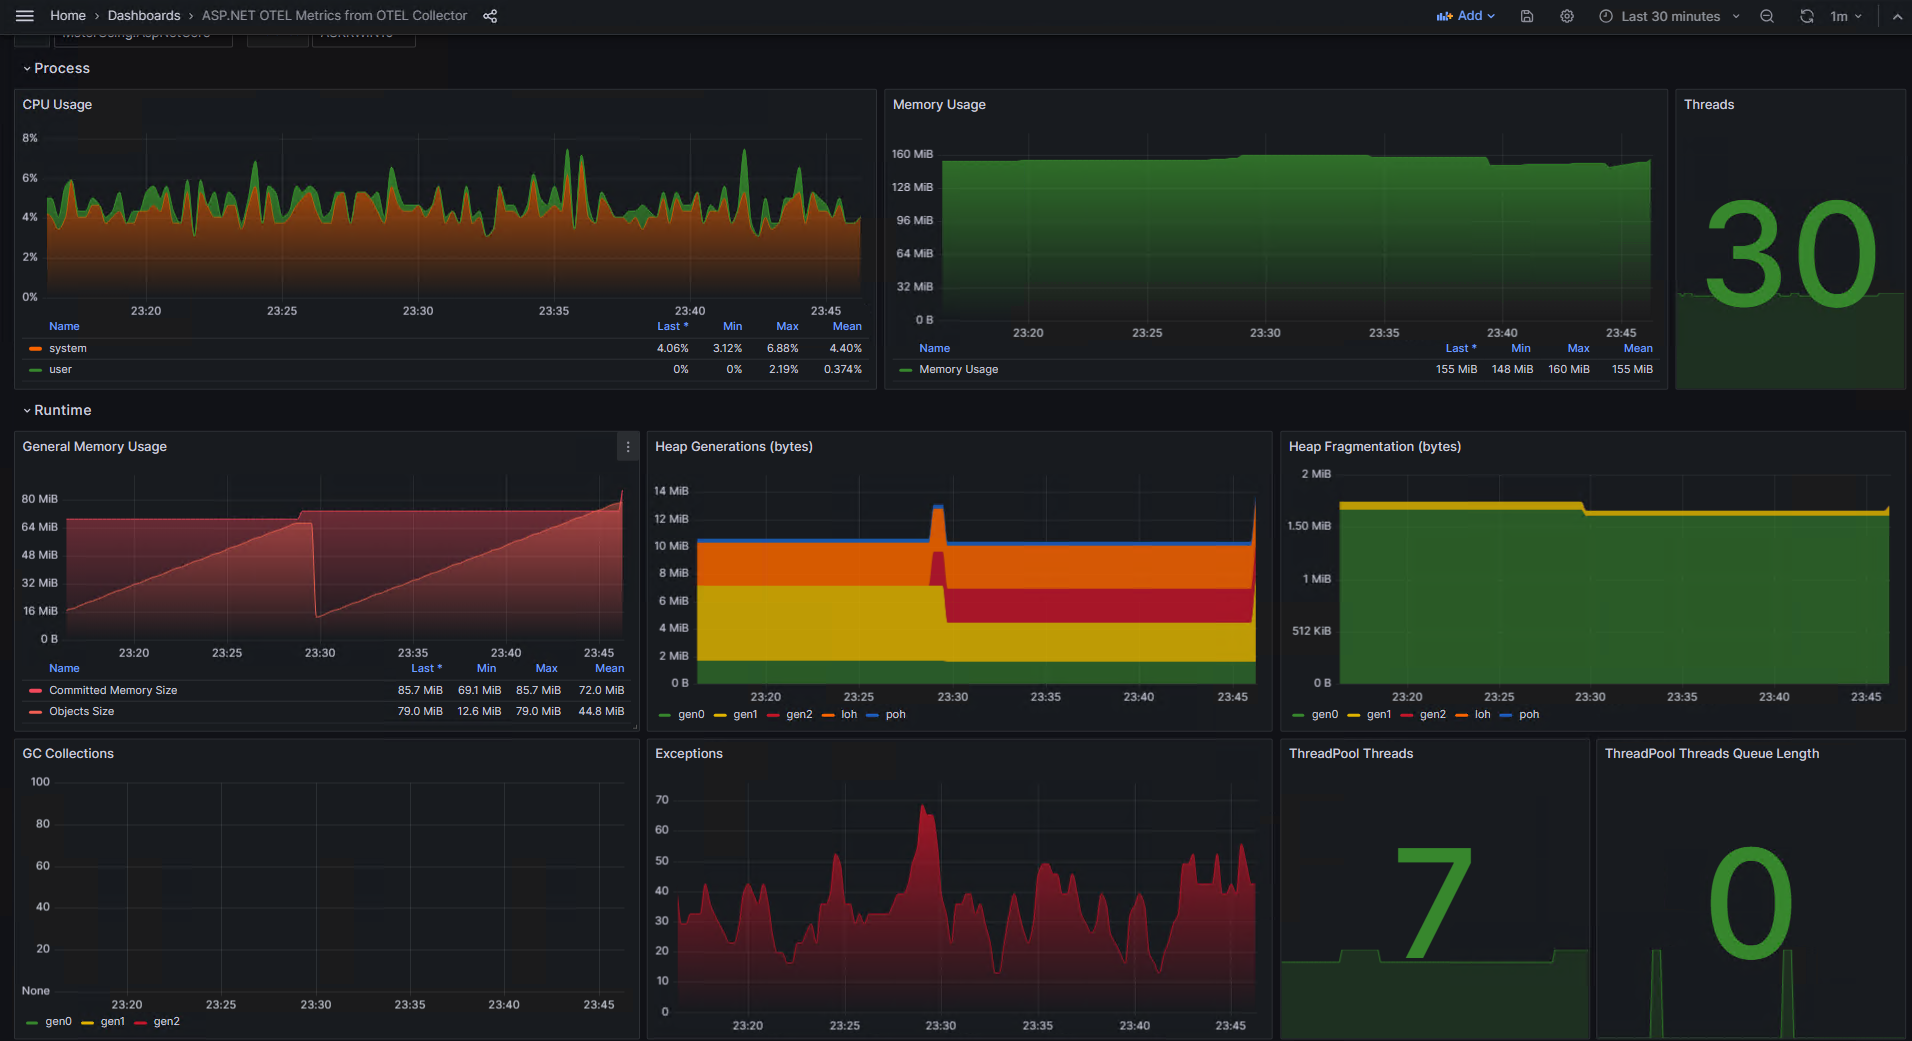
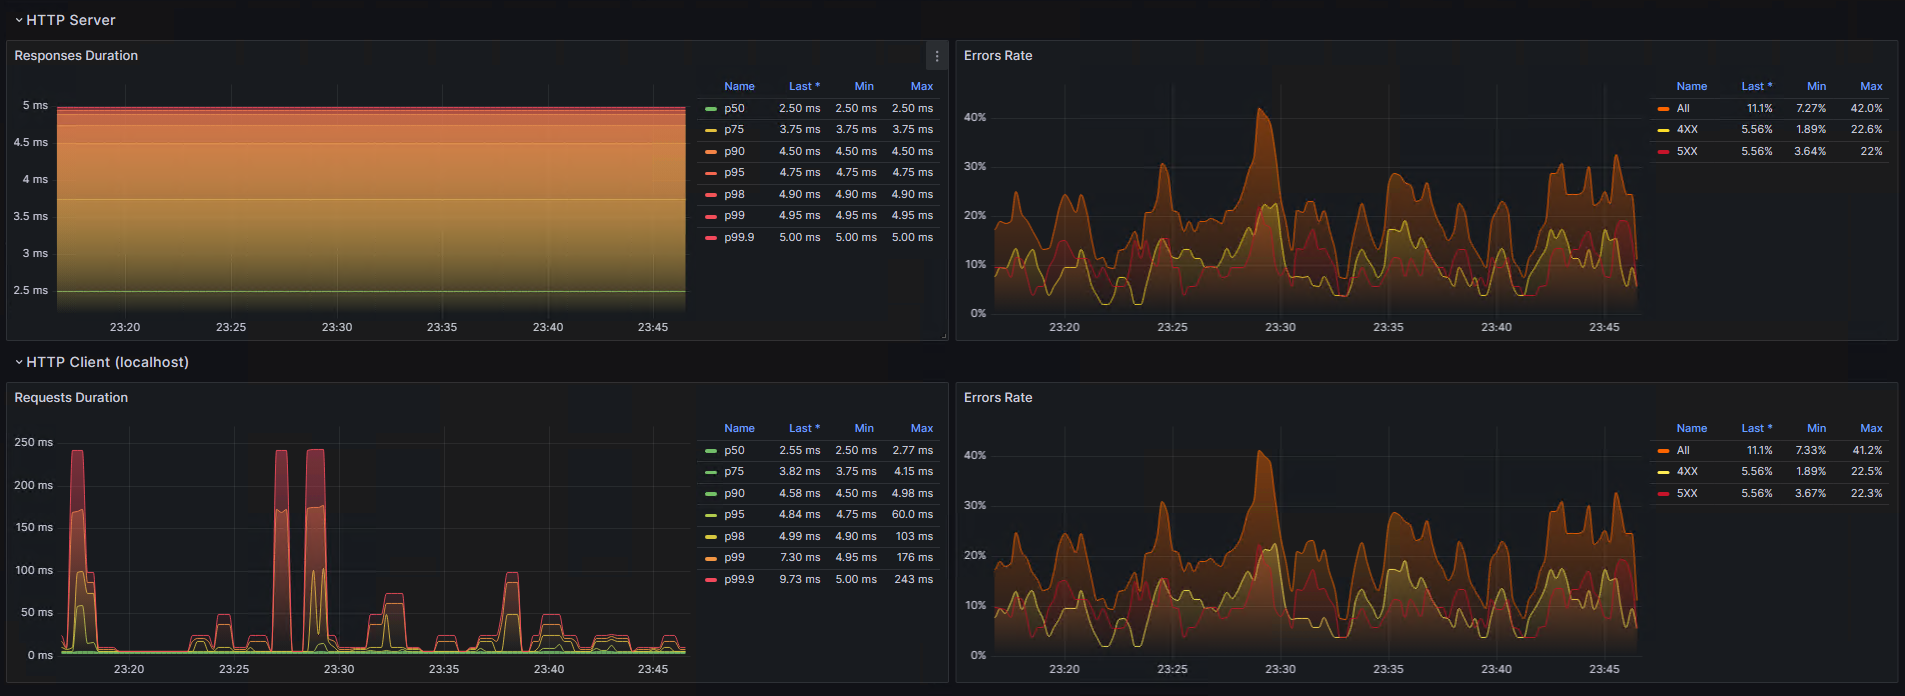
Shows .NET and ASP.NET metrics pushed to OTEL Collector and scraped by Prometheus from OTEL Collector
The dashboard shows .NET and ASP.NET (.NET Core/5/6/7) metrics produced by OTLP instruments and injected into an application. These metrics are pushed to the OpenTelemetry Collector. Then, the Collector exposes the metrics to scrape by Prometheus. Then the Grafana dashboard reads the metrics from Prometheus.
In order to inject the metrics gathering, it is necessary to install the following Nuget packages:
- OpenTelemetry.Instrumentation.AspNetCore
- OpenTelemetry.Instrumentation.Http
- OpenTelemetry.Instrumentation.Process
- OpenTelemetry.Instrumentation.Runtime
Example of instrumentation enabling in the ASP.NET application:
builder.Services.AddOpenTelemetry() // OpenTelemetry.Extensions.Hosting package
    .ConfigureResource(r => r.AddService("My App", serviceInstanceId: Environment.MachineName))
    .WithMetrics(meterBuilder => meterBuilder
        .AddAspNetCoreInstrumentation() // OpenTelemetry.Instrumentation.AspNetCore package
        .AddHttpClientInstrumentation() // OpenTelemetry.Instrumentation.Http package
        .AddRuntimeInstrumentation() // OpenTelemetry.Instrumentation.Runtime package
        .AddProcessInstrumentation() // OpenTelemetry.Instrumentation.Process package
        .AddOtlpExporter()
    );
Example of instrumentation enabling in the console .NET application:
using var meterProvider = Sdk.CreateMeterProviderBuilder()
    .SetResourceBuilder(ResourceBuilder.CreateDefault().AddService("MyApp"))
    .AddAspNetCoreInstrumentation() // OpenTelemetry.Instrumentation.AspNetCore package
    .AddHttpClientInstrumentation() // OpenTelemetry.Instrumentation.Http package
    .AddRuntimeInstrumentation() // OpenTelemetry.Instrumentation.Runtime package
    .AddProcessInstrumentation() // OpenTelemetry.Instrumentation.Process  package
    .AddOtlpExporter()
    .Build();
The dashboard was based on the ASP.NET OTEL Metrics dashboard. Metric names were improved according to name rules followed by the OtlpExporter and the Colector.
leakyheap, thank you so much.
Souce code of .NET applications and docker containers configurations can be found here: https://github.com/askrinnik/OtlpMeterUsing. See Push model examples.
Data source config
Collector config:
Upload an updated version of an exported dashboard.json file from Grafana
| Revision | Description | Created | |
|---|---|---|---|
| Download |


