
Azure / Container Insights / Syslog
Dashboard visualizing Syslog records collected by Azure Monitor
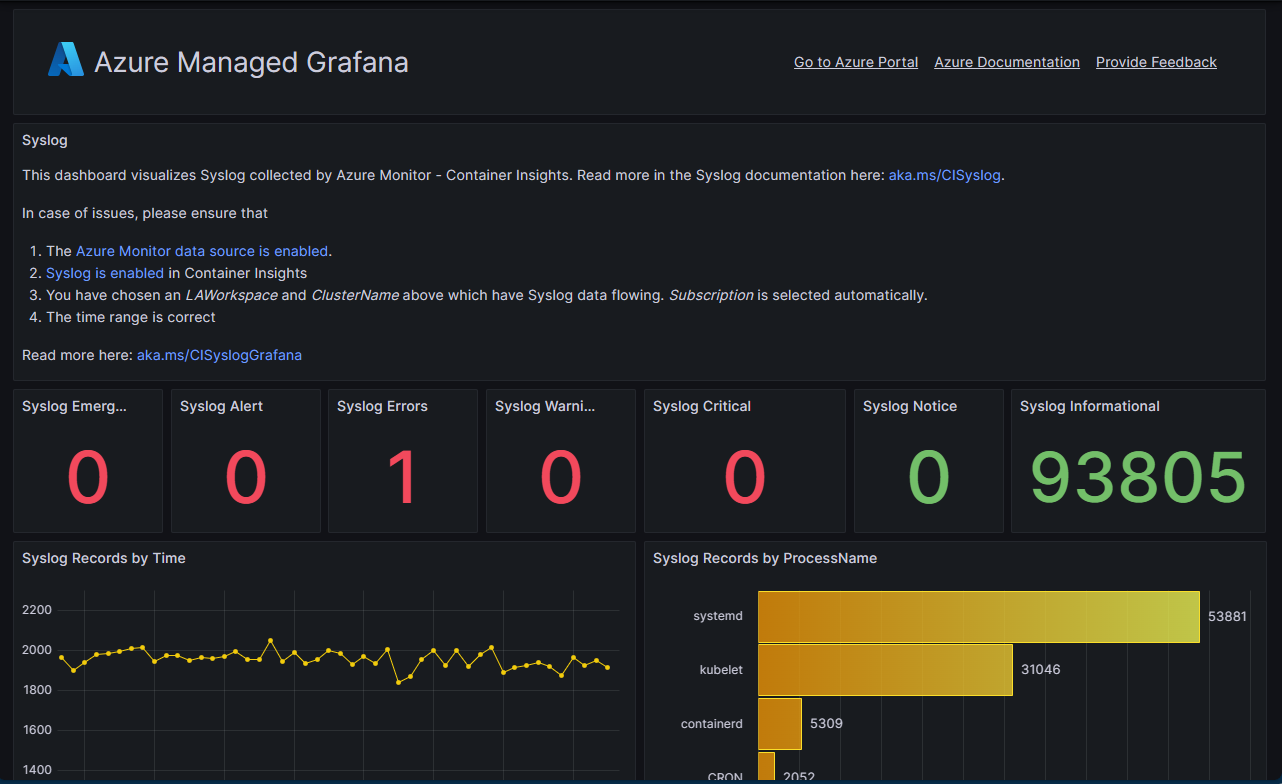
Azure Monitor - Container Insights offers the ability to collect Syslog events from Linux nodes in your Azure Kubernetes Service (AKS) clusters. This includes the ability to collect logs from control plane components like kubelet. Customers can also use Syslog for monitoring security and health events, typically by ingesting syslog into a SIEM system like Microsoft Sentinel.
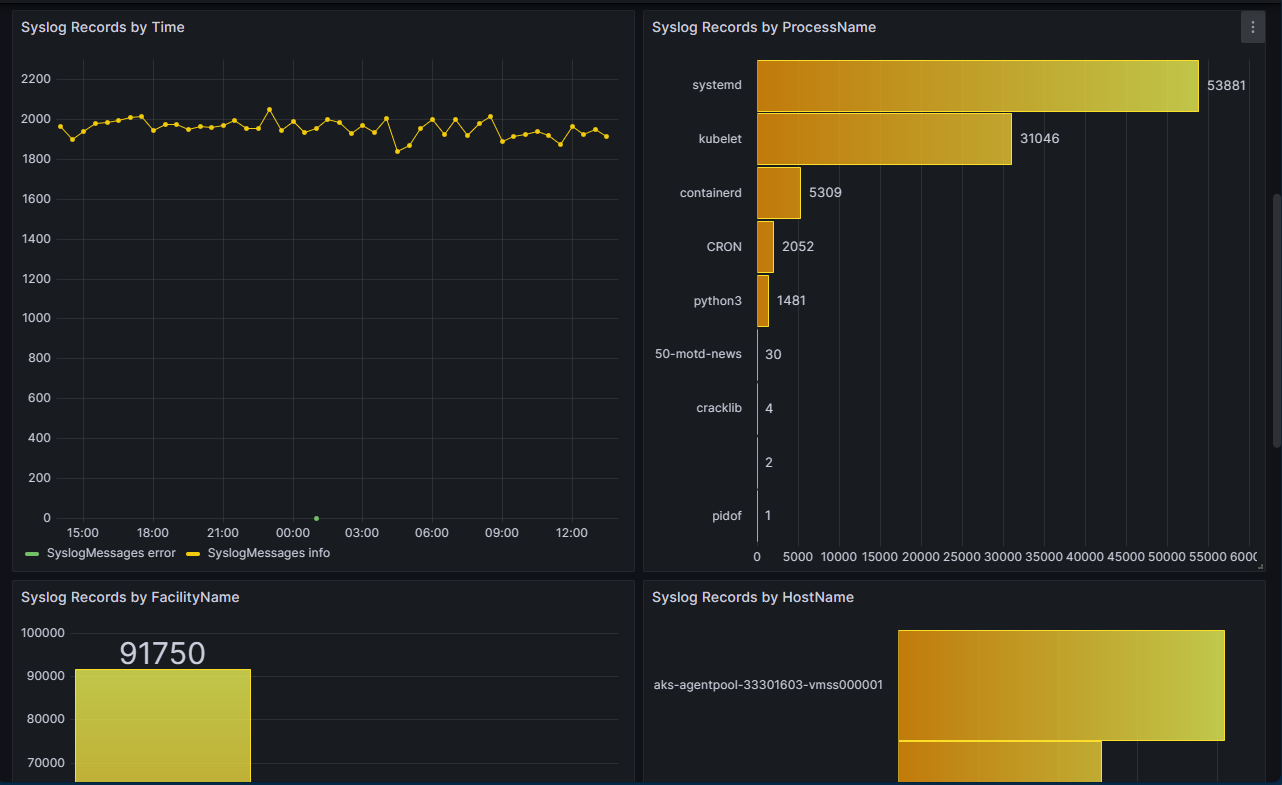
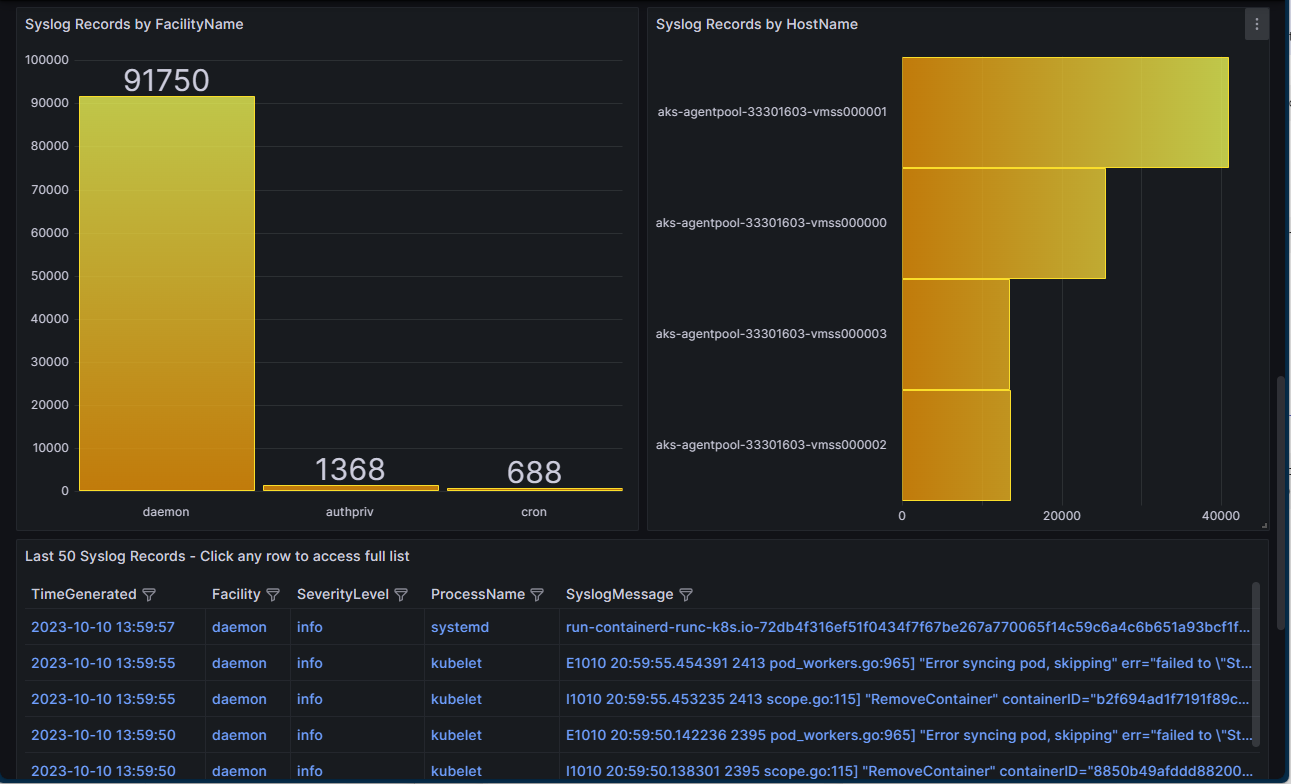
With this Syslog Grafana dashboard from Azure Monitor, users can get a quick snapshot of syslog messages. At a glance, users can see if there’s a large number of critical or warning messages. The dashboards also breaks down syslog message counts by host, process, and facility name - making it easier understand where errors might be coming from. Additionally, users can see the 50 most recent Syslog messages and click through to access the full Syslog table in Log Analytics.
Data source config
Collector config:
Upload an updated version of an exported dashboard.json file from Grafana
| Revision | Description | Created | |
|---|---|---|---|
| Download |
Azure Cosmos DB
With the Grafana plugin for Azure Cosmos DB, you can quickly visualize and query your Azure Cosmos DB data from within Grafana.
Learn more