Apache JMeter Grafana Dashboard | SpeckyFox Technologies
Monitor your Apache JMeter load test in real time with InfluxDB and Grafana. Get overall summary, error details and particular transaction response times. A dashboard by Speckyfox Technologies
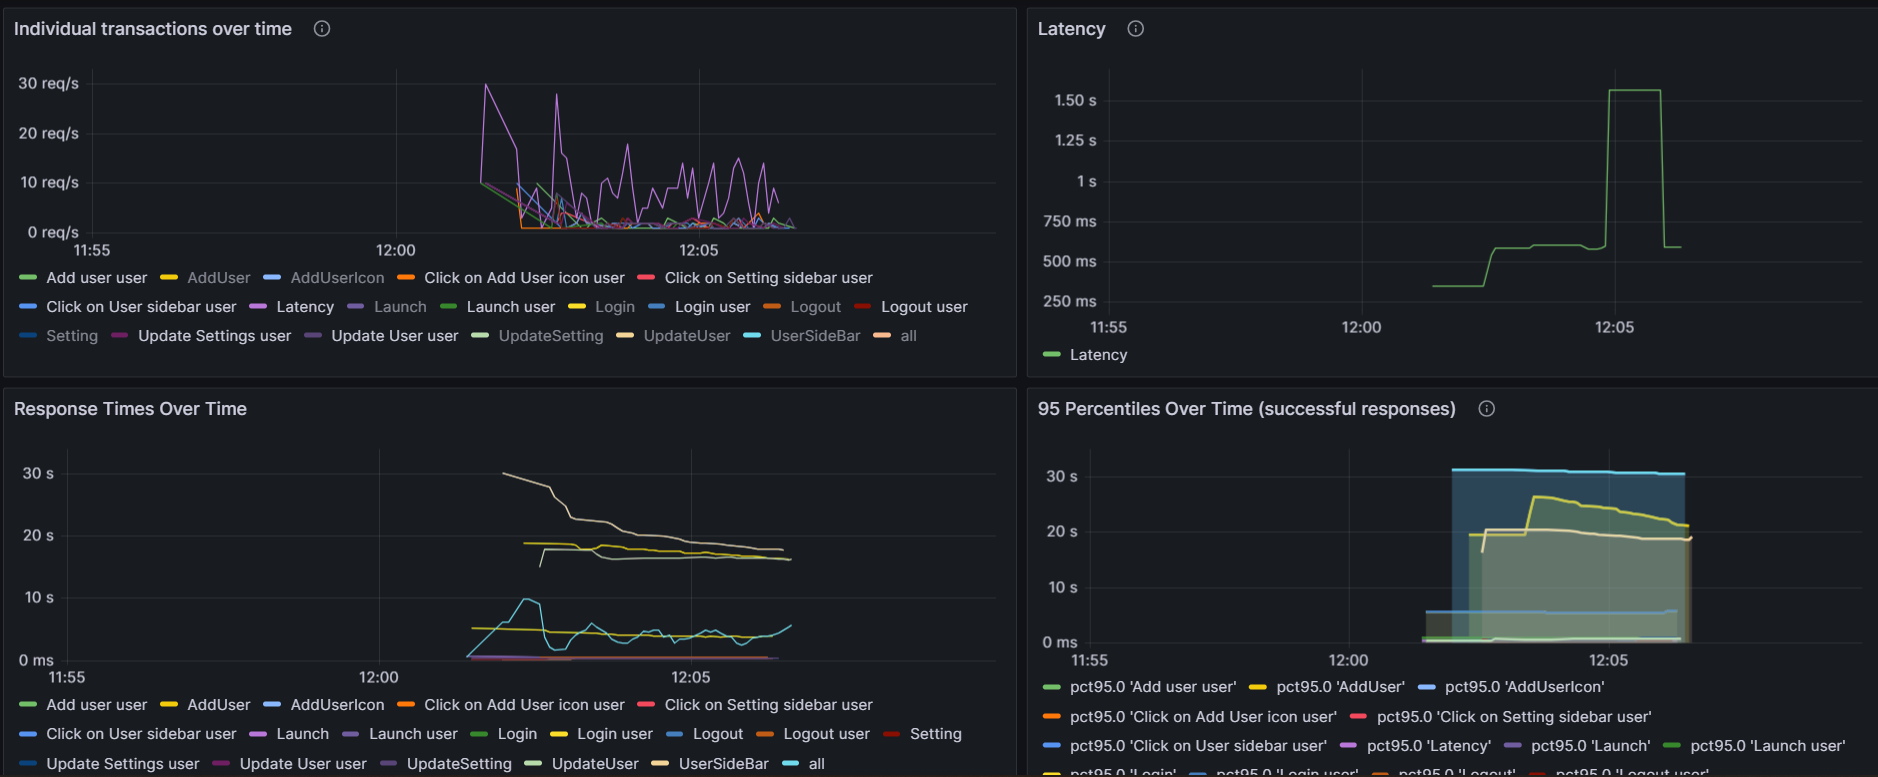
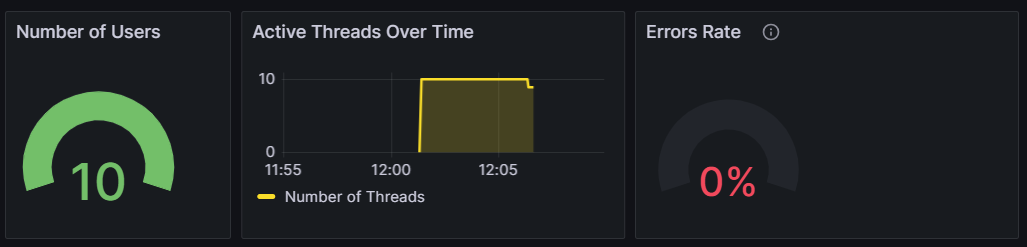
The Apache JMeter Grafana Dashboard | SpeckyFox Technologies dashboard uses the influxdb data source to create a Grafana dashboard with the gauge, table and timeseries panels.
Data source config
Collector type:
Collector plugins:
Collector config:
Revisions
Upload an updated version of an exported dashboard.json file from Grafana
| Revision | Description | Created | |
|---|---|---|---|
| Download |