bettertop
The dashboard built using these instructions: https://www.junosnotes.com/devops/monitoring-linux-processes-using-prometheus-and-grafana/
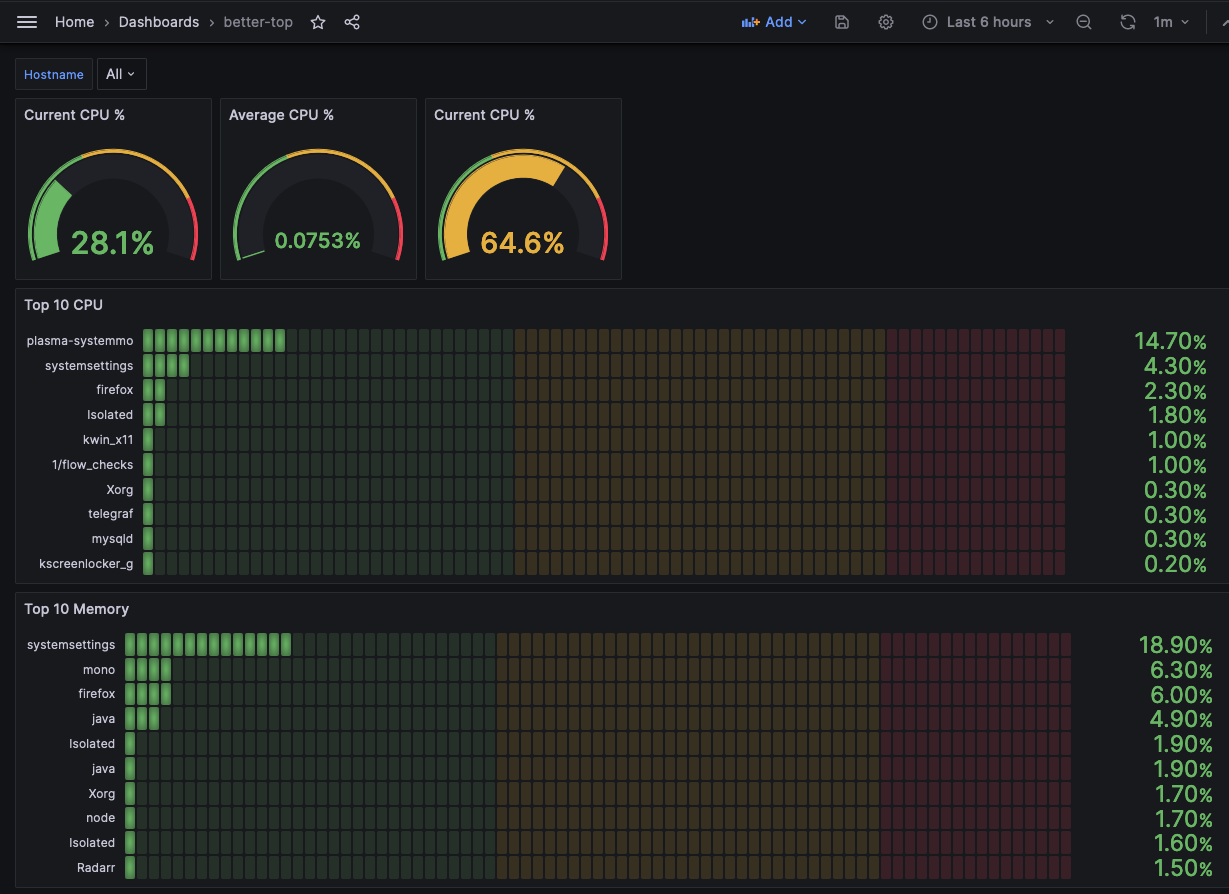
Here are the top scripts that push CPU and RAM metrics to Prometheus:
$ cat better-top.sh #!/bin/bash #z=$(ps aux) z=$(ps auxc) while read -r z do var=$var$(awk '{print "cpu_usage{hostname="plex-addons", process=""$11"", pid=""$2""}", $3z}'); done <<< "$z" curl -X POST -H "Content-Type: text/plain" --data "$var " http://localhost:9091/metrics/job/top/instance/machine
====
$ cat better-top-ram.sh #!/bin/bash #z=$(ps aux) z=$(ps auxc) while read -r z do var=$var$(awk '{print "memory_usage{hostname="plex-addons", process=""$11"", pid=""$2""}", $4z}'); done <<< "$z" curl -X POST -H "Content-Type: text/plain" --data "$var " http://localhost:9091/metrics/job/top/instance/machine
Data source config
Collector config:
Upload an updated version of an exported dashboard.json file from Grafana
| Revision | Description | Created | |
|---|---|---|---|
| Download |