Atempo Miria
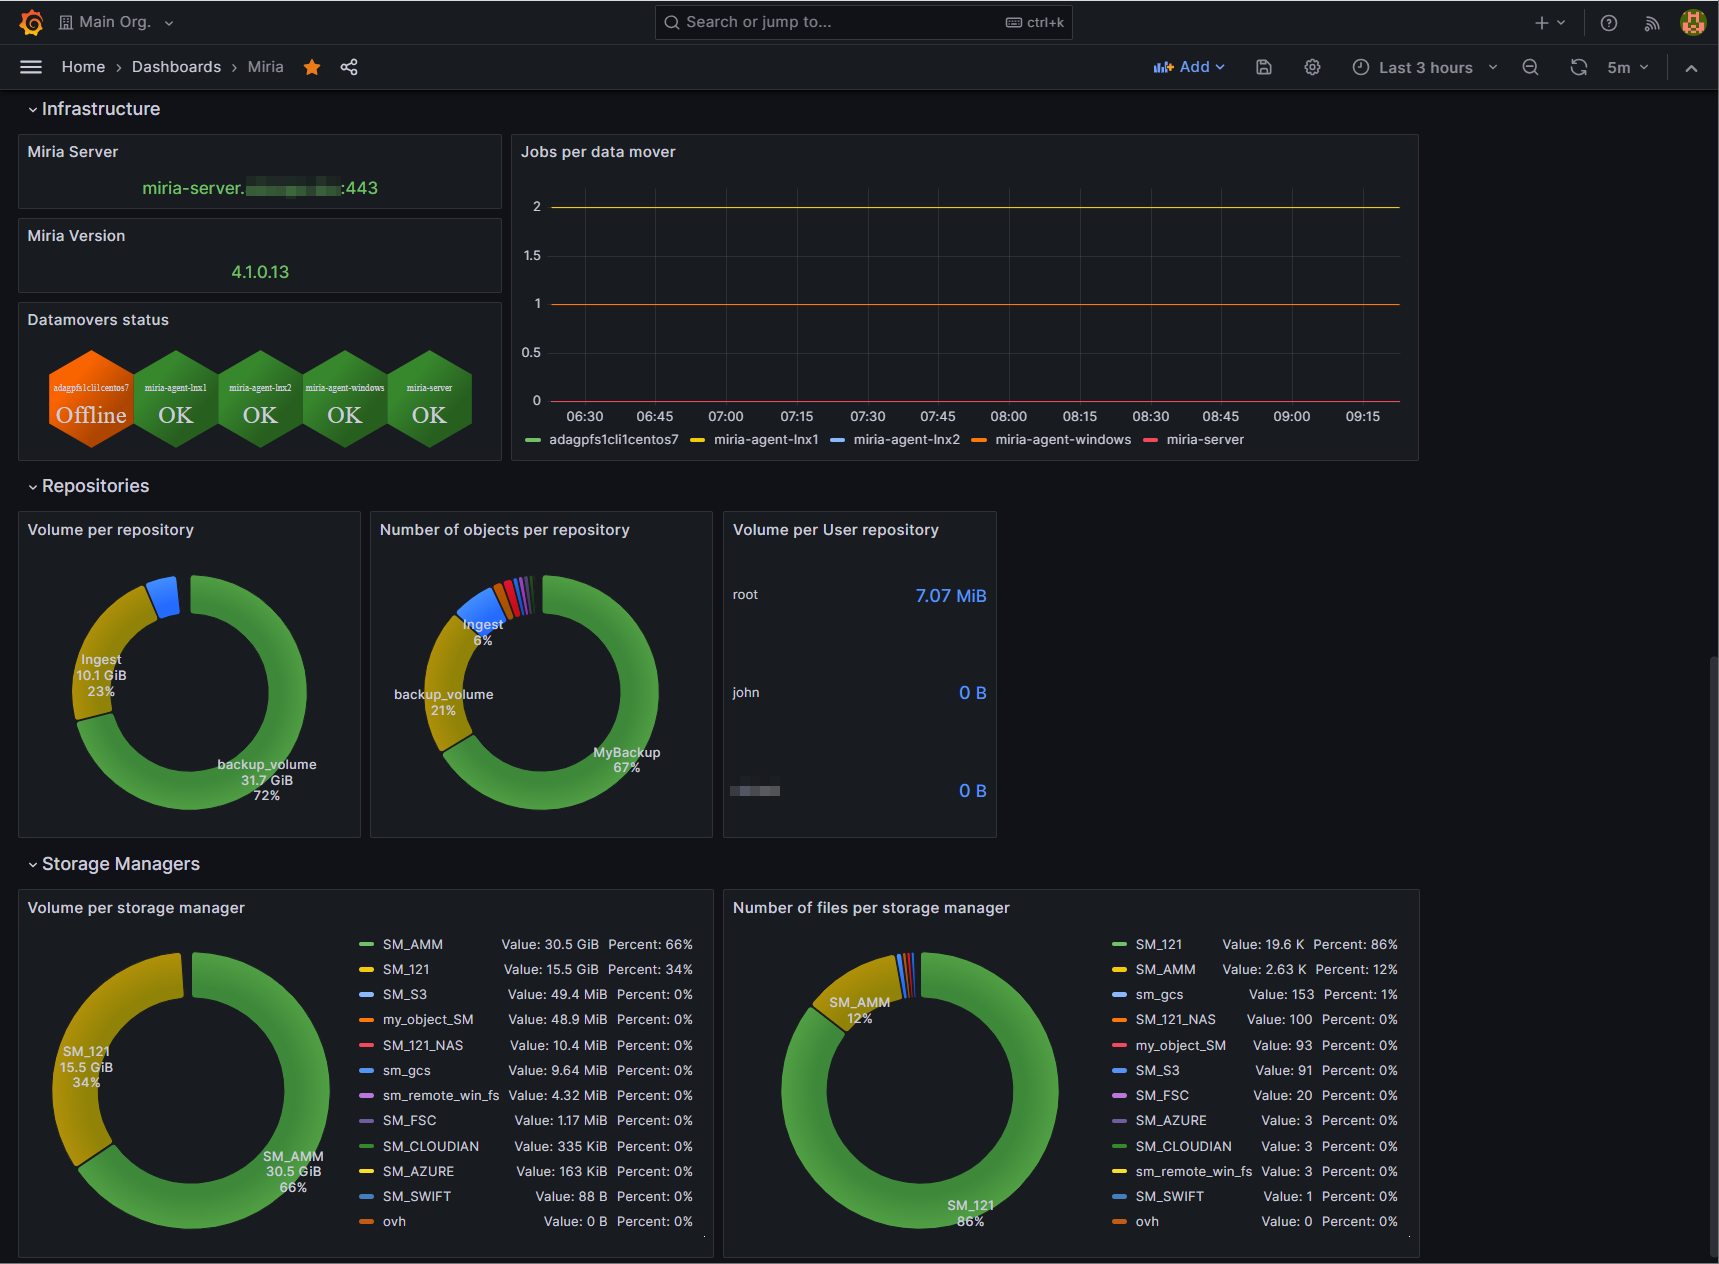
Dashboard for Atempo Miria Data Management
Prerequisites
This dashboard requires :
- Miria server version 4.1 or superior
- Grafana with Polystat plugin
- Prometheus for scraping
Integration with Prometheus and Grafana through OpenMetrics
Miria API is exposing some metrics following OpenMetrics standard allowing advanced supervision and monitoring using external tools such as Prometheus (for collecting and storing metrics) and Grafana (for visualization).
Note: OpenMetrics format is compatible with other softwares such as Telegraf, Datadog, VictoriaMetrics.
How to configure Prometheus
The metrics endpoint is available by default on /restapi/metrics?database=ADA (replace ADA with your database name if your are not using default name) Access to this endpoint can be tested manually using default API authentication (through Swagger or ReDoc documentation for example).
For production use, it must be configured to accept requests based on source IPs (usually the IPs of your Prometheus scrapers). To authorize some IPs, add the following variable to the /Miria/restapi/.env file on Miria server:
ALLOW_METRICS_FOR_IP="10.0.0.1,10.1.2.3"
Replace 10.0.0.1,10.1.2.3 by the list of comma-separated IP values of your environment. Wildcards and IP ranges are not supported.
Restart Apache service on Miria server to apply modifications.
Example of Prometheus configuration
This is an example of Prometheus configuration to scrape Miria metrics
Extract of scrape_configs section of prometheus.yml configuration file :
  - job_name: 'miria'
    scrape_interval: 5m
    scrape_timeout: 1m
    params:
      database: ['ADA']
    metrics_path: /restapi/metrics
    scheme: https
    tls_config:
      insecure_skip_verify: true
    static_configs:
      - targets: ['miria-server.yourdomain.com']
Replace ADA with your Miria database name. If you have multiple databases, you must create one scrape config per database.
Note: Parameter insecure_skip_verify: true is only required if your Miria server certificate is not valid (self-signed or unknown authority).
Import dashboard
Import the current dashboard into Grafana.
Data source config
Collector config:
Upload an updated version of an exported dashboard.json file from Grafana
| Revision | Description | Created | |
|---|---|---|---|
| Download |