Queries with high Examined/Sent rate
The dashboard will display the rate of queries that have been examined and sent.
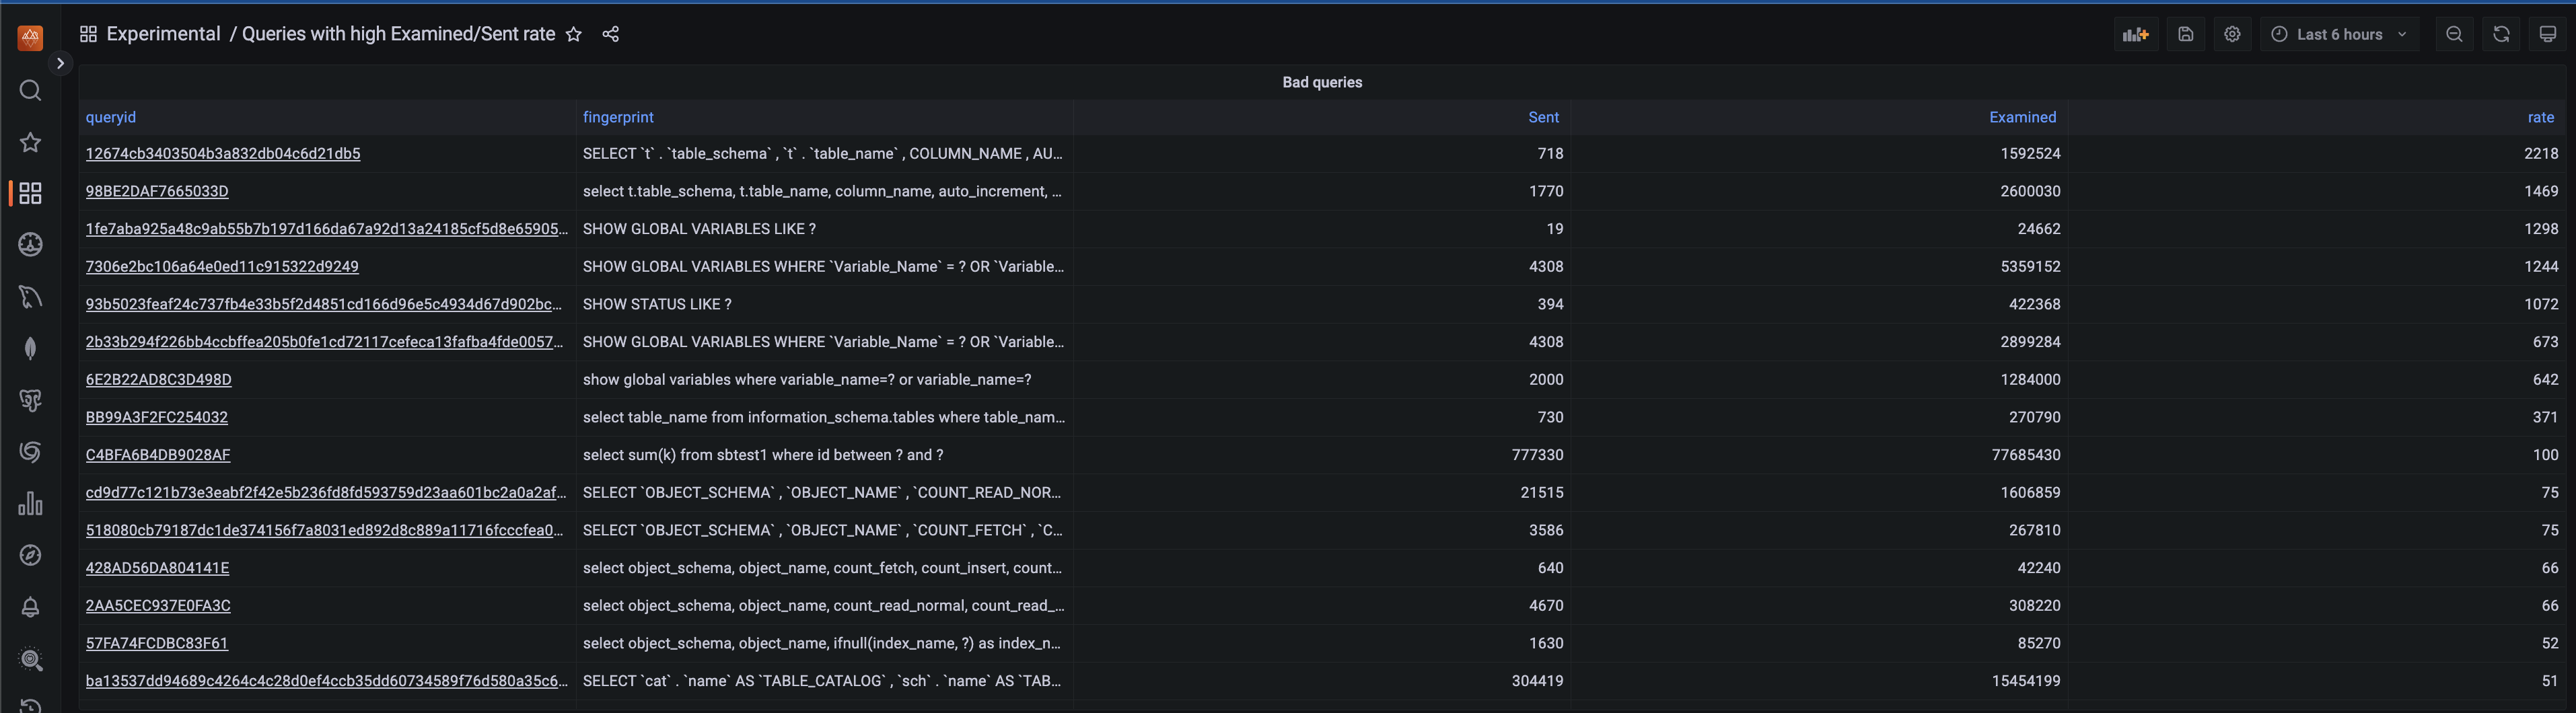
The Queries with high Examined/Sent rate dashboard uses the grafana-clickhouse-datasource data source to create a Grafana dashboard with the table panel.
Data source config
Collector type:
Collector plugins:
Collector config:
Revisions
Upload an updated version of an exported dashboard.json file from Grafana
| Revision | Description | Created | |
|---|---|---|---|
| Download |