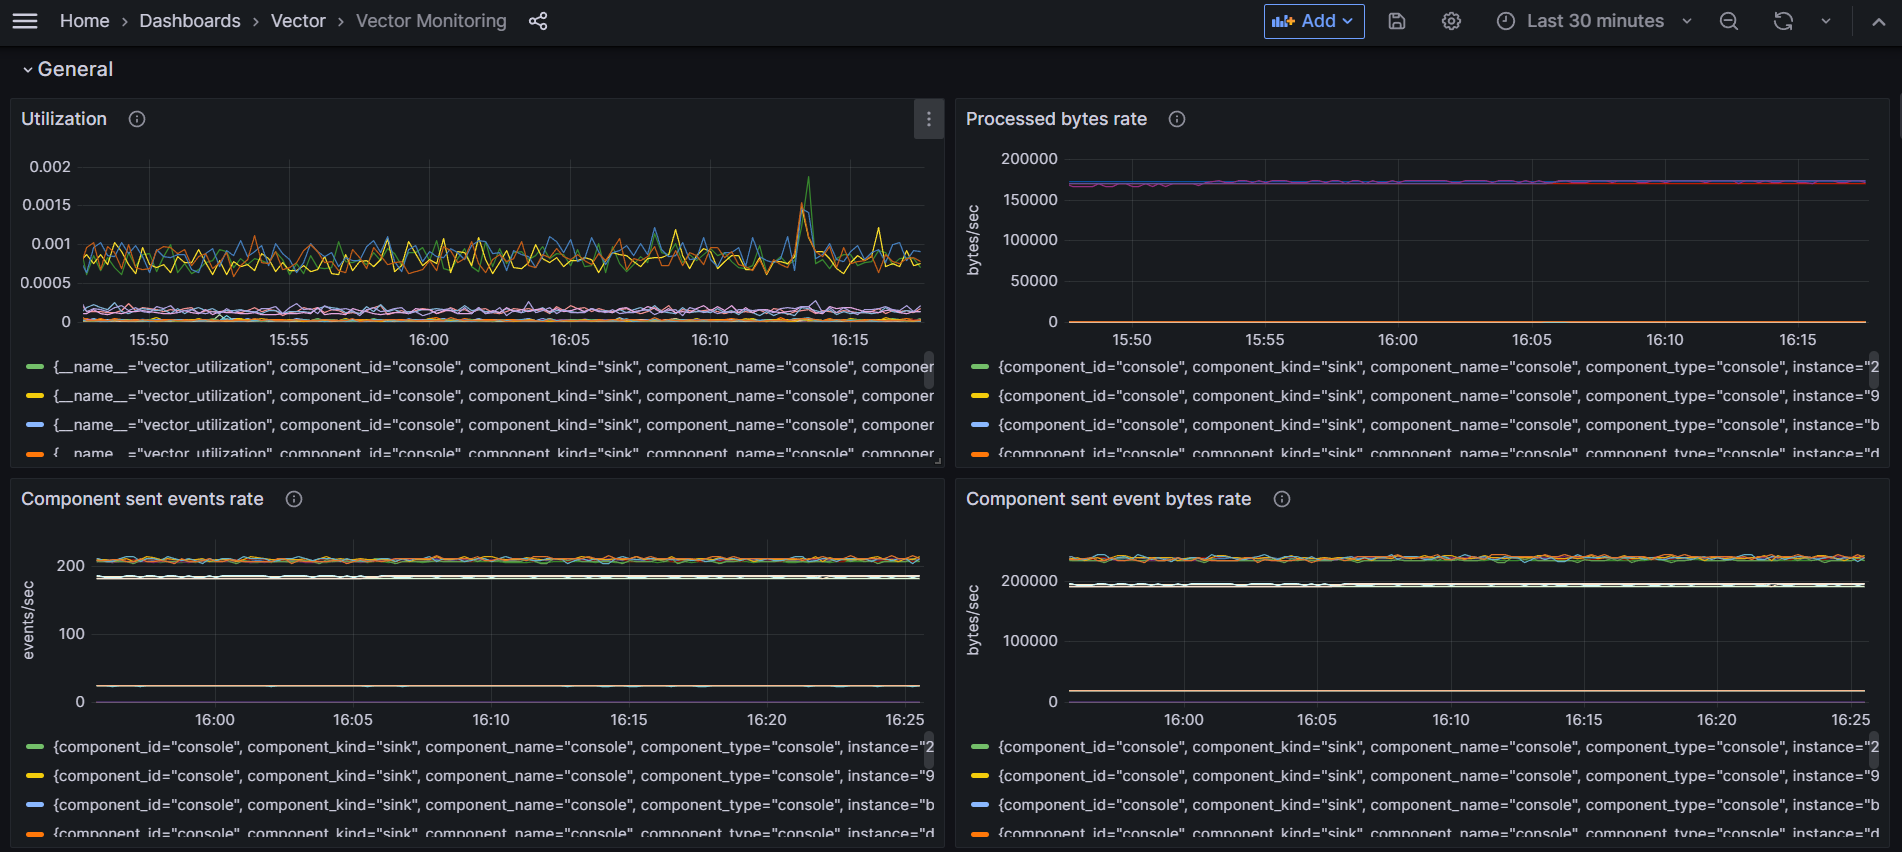
Vector Monitoring
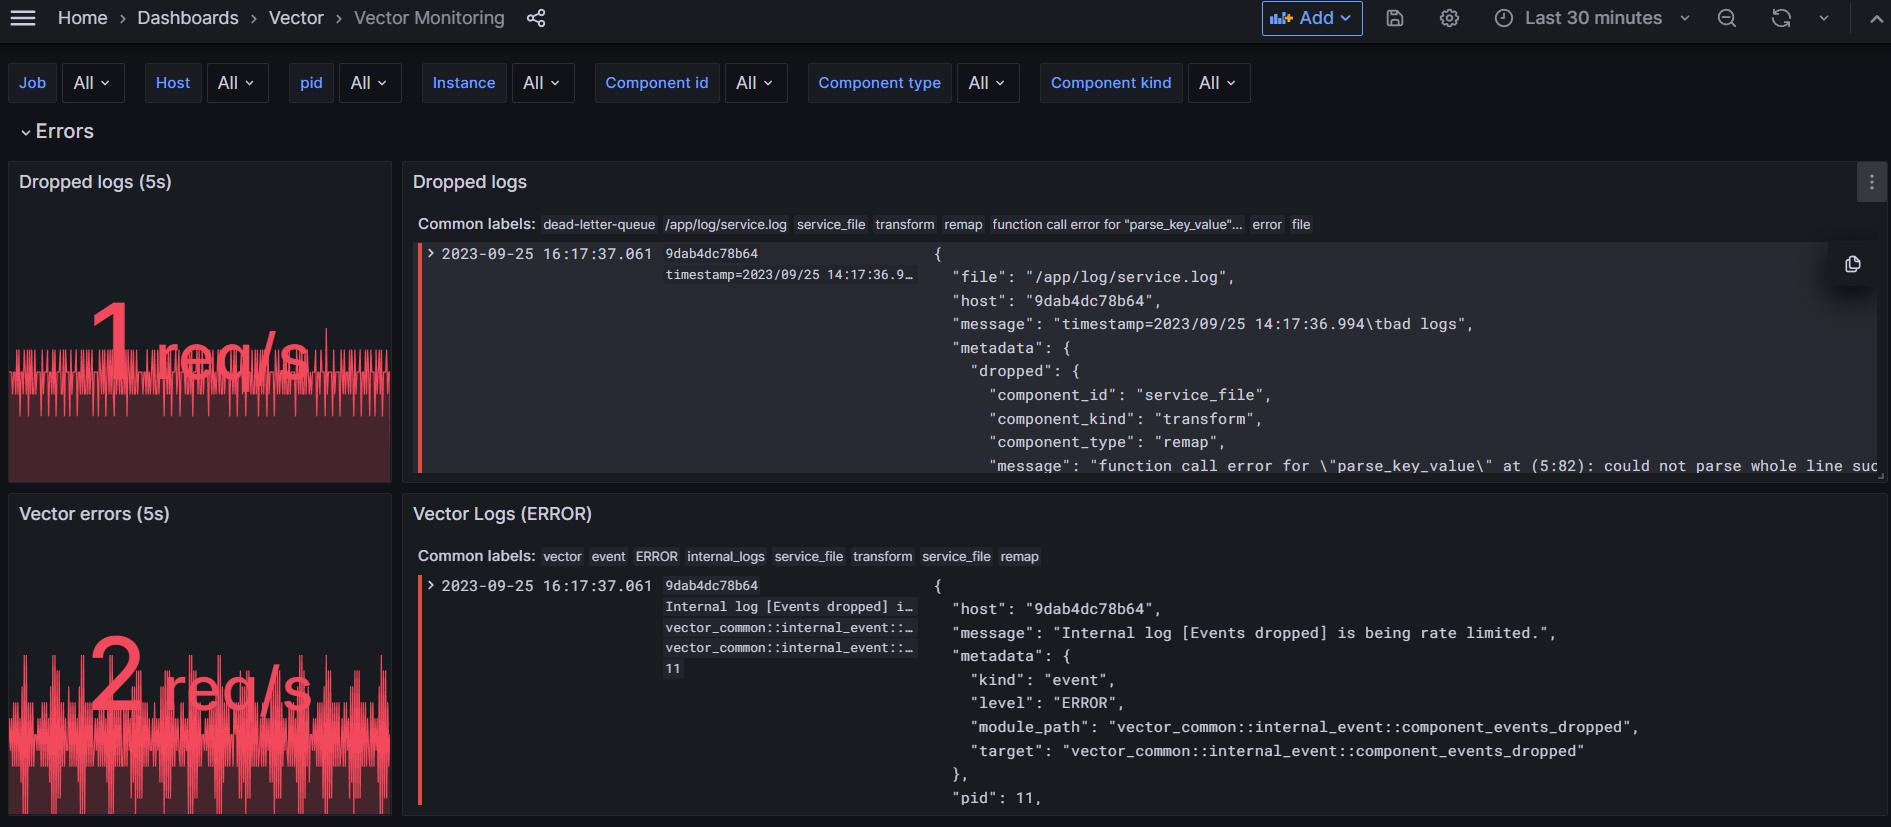
This Grafana dashboard to monitor Vector.dev community to properly monitor agent, pipeline and dead letter queue
Vector.dev community dashboard compatible with GrafanaCloud
This dashboard is based on USE method to properly monitor agent.
You can find associated vector configuration to support dead letter queue and logs from vector.dev
References:
This dashboard is hosted on github
Data source config
Collector type:
Collector plugins:
Collector config:
Revisions
Upload an updated version of an exported dashboard.json file from Grafana
| Revision | Description | Created | |
|---|---|---|---|
| Download |