Aerospike Connectors JVM
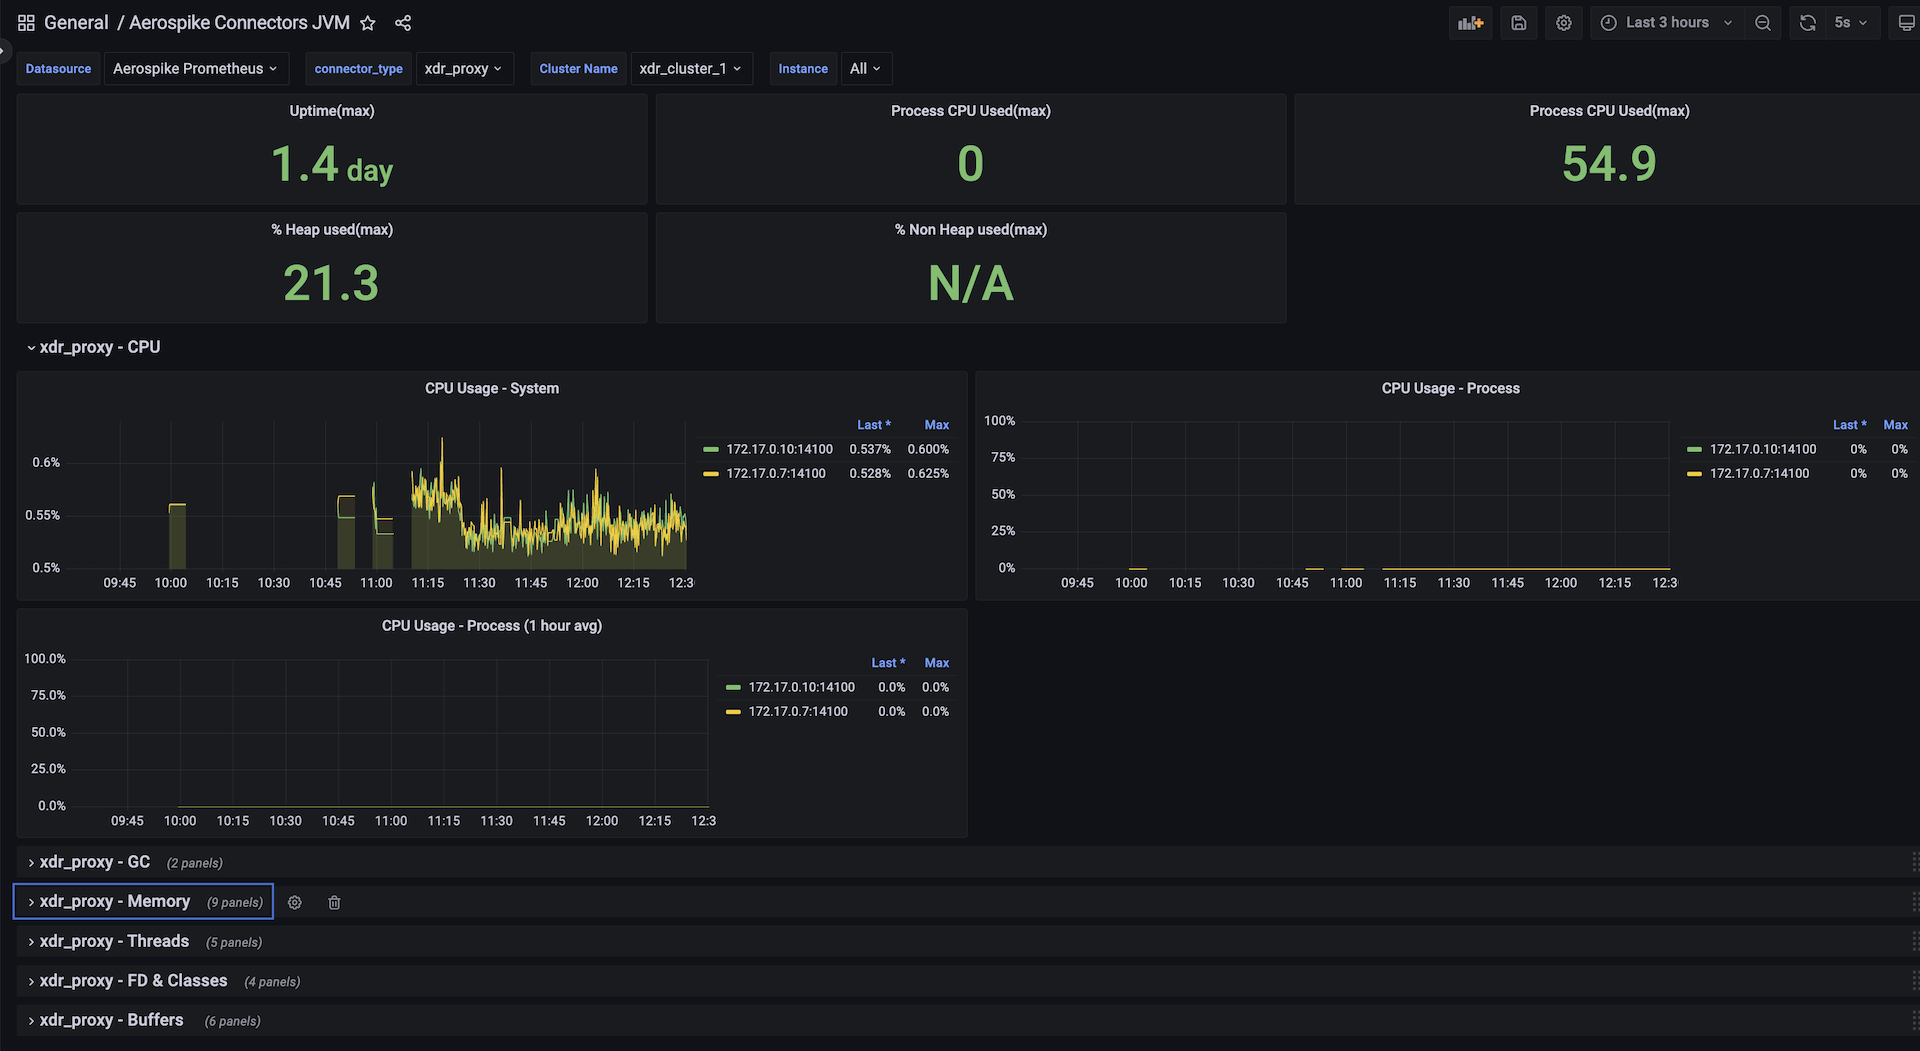
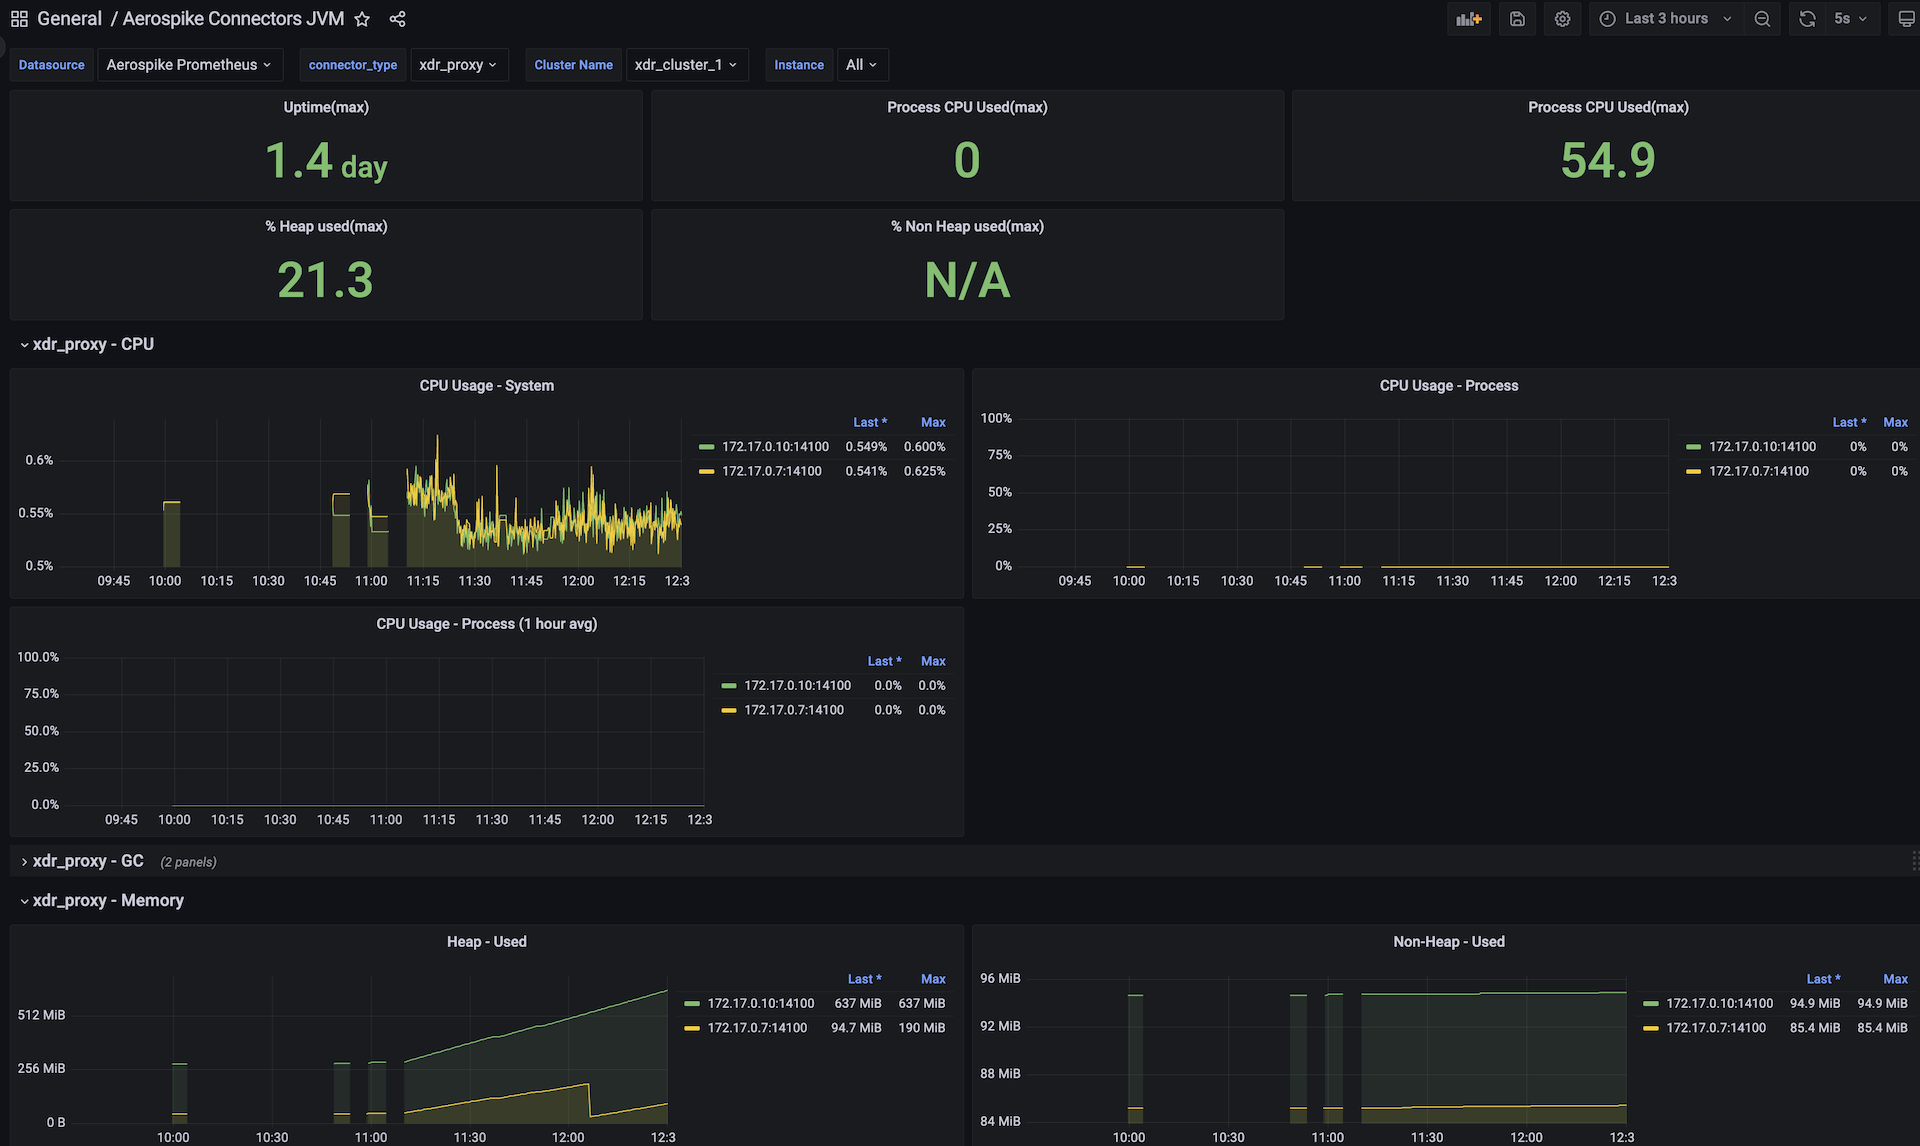
This dashboard covers 6 connectors XDR-Proxy, Kafka-Outboud, Pulsar-Outboud, JMS-Outboud, ESP-Outbound, Elastic-Search in a single view. various clusters of each connector can selected/filtered and covers key java-virtual-machine metrics like Memory, CPU, Memory, Threads, Classes, File-Descriptors and Buffers
Aerospike Connector JVM View dashboard for Aerospike Monitoring Stack
This dashboard covers 6 connectors XDR-Proxy, Kafka-Outboud, Pulsar-Outboud, JMS-Outboud, ESP-Outbound, Elastic-Search in a single view. various clusters of each connector can selected/filtered and covers key java-virtual-machine metrics like Memory, CPU, Memory, Threads, Classes, File-Descriptors and Buffers. Each group of metric is shown in individual rows
This dashboard collates various critical metrics to be monitored while using all-flash storage for data, index or sindex'es. some of the key metrics are objects per sprig, index-pressure etc.,
Aerospike's Monitoring Stack extracts operational metrics from Aerospike database clusters for visualization and analysis in Prometheus and Grafana.
See Aerospike Monitoring Stack Architecture and Aerospike Monitoring Stack Installation for more details
Data source config
Collector config:
Upload an updated version of an exported dashboard.json file from Grafana
| Revision | Description | Created | |
|---|---|---|---|
| Download |
Aerospike
Easily monitor Aerospike, a multi-modal NoSQL and graph database, with Grafana Cloud's out-of-the-box monitoring solution.
Learn more