Aerospike Outbound Connector View
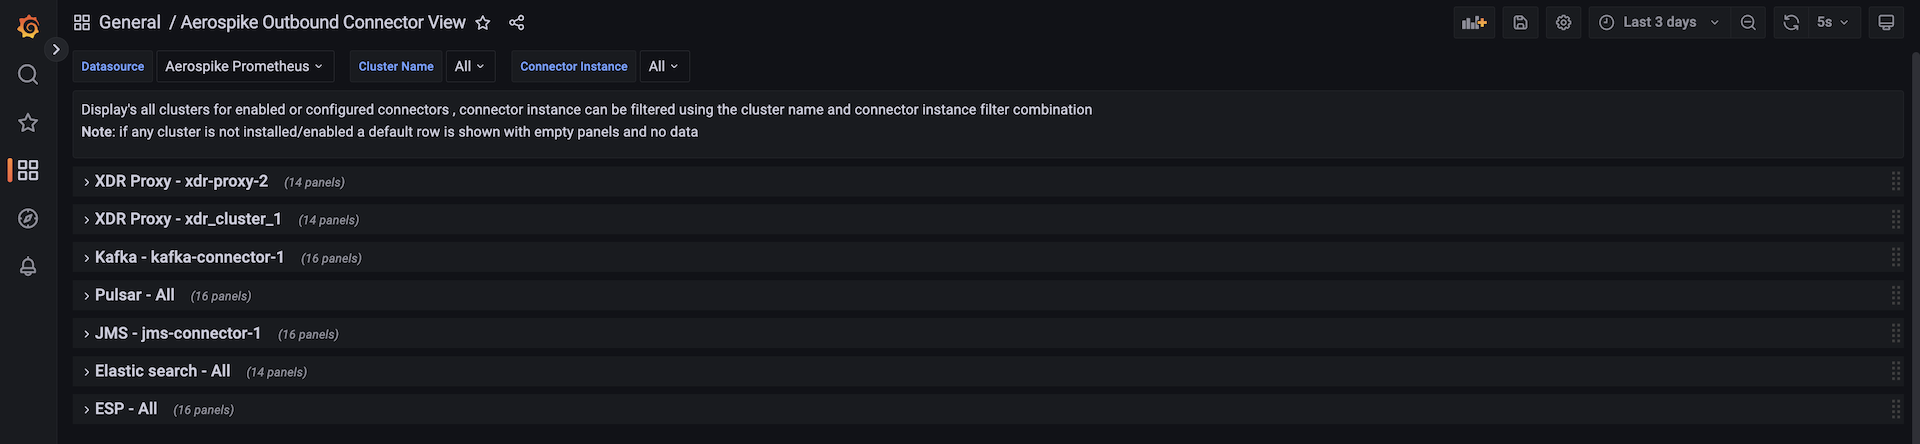
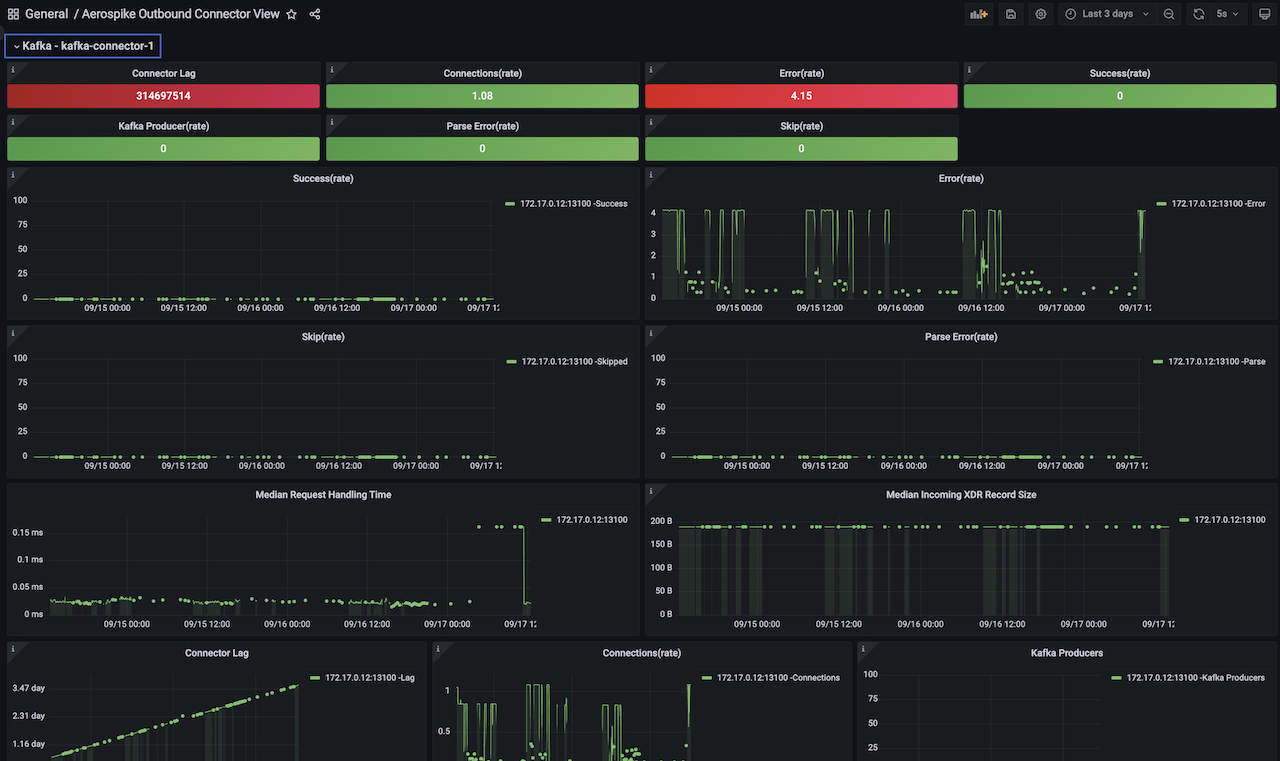
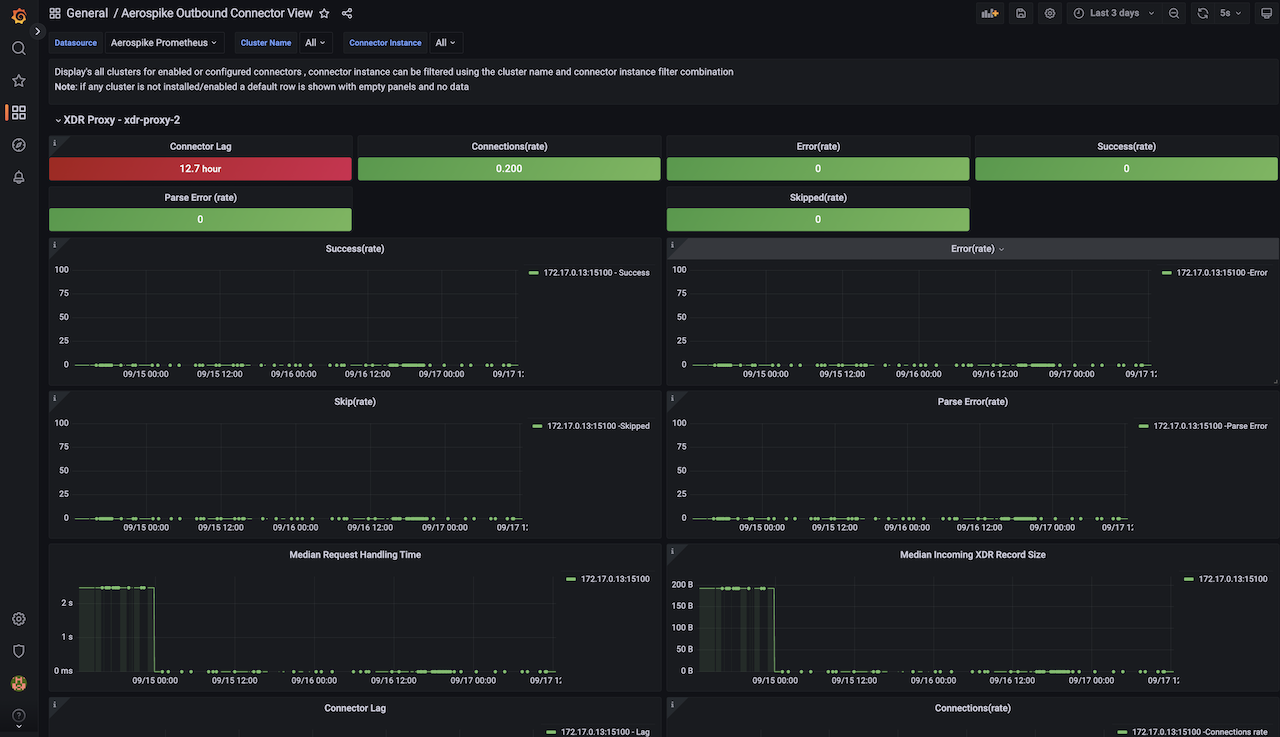
This dashboard covers 6 connectors XDR-Proxy, Kafka-Outboud, Pulsar-Outboud, JMS-Outboud, ESP-Outbound, Elastic-Search in a single view. various clusters of each connector is shown as a row and covers key functional metrics to monitor like request-lag, request error, skipped, parse-errors, connections, xdr record size etc.,
Aerospike Outbound Connector View dashboard for Aerospike Monitoring Stack
This dashboard covers 6 connectors XDR-Proxy, Kafka-Outboud, Pulsar-Outboud, JMS-Outboud, ESP-Outbound, Elastic-Search in a single view. various clusters of each connector is shown as a row and covers key functional metrics to monitor like request-lag, request error, skipped, parse-errors, connections, xdr record size etc.,
Aerospike's Monitoring Stack extracts operational metrics from Aerospike database clusters for visualization and analysis in Prometheus and Grafana.
See Aerospike Monitoring Stack Architecture and Aerospike Monitoring Stack Installation for more details
Data source config
Collector config:
Upload an updated version of an exported dashboard.json file from Grafana
| Revision | Description | Created | |
|---|---|---|---|
| Download |
Aerospike
Easily monitor Aerospike, a multi-modal NoSQL and graph database, with Grafana Cloud's out-of-the-box monitoring solution.
Learn more