
Truenas
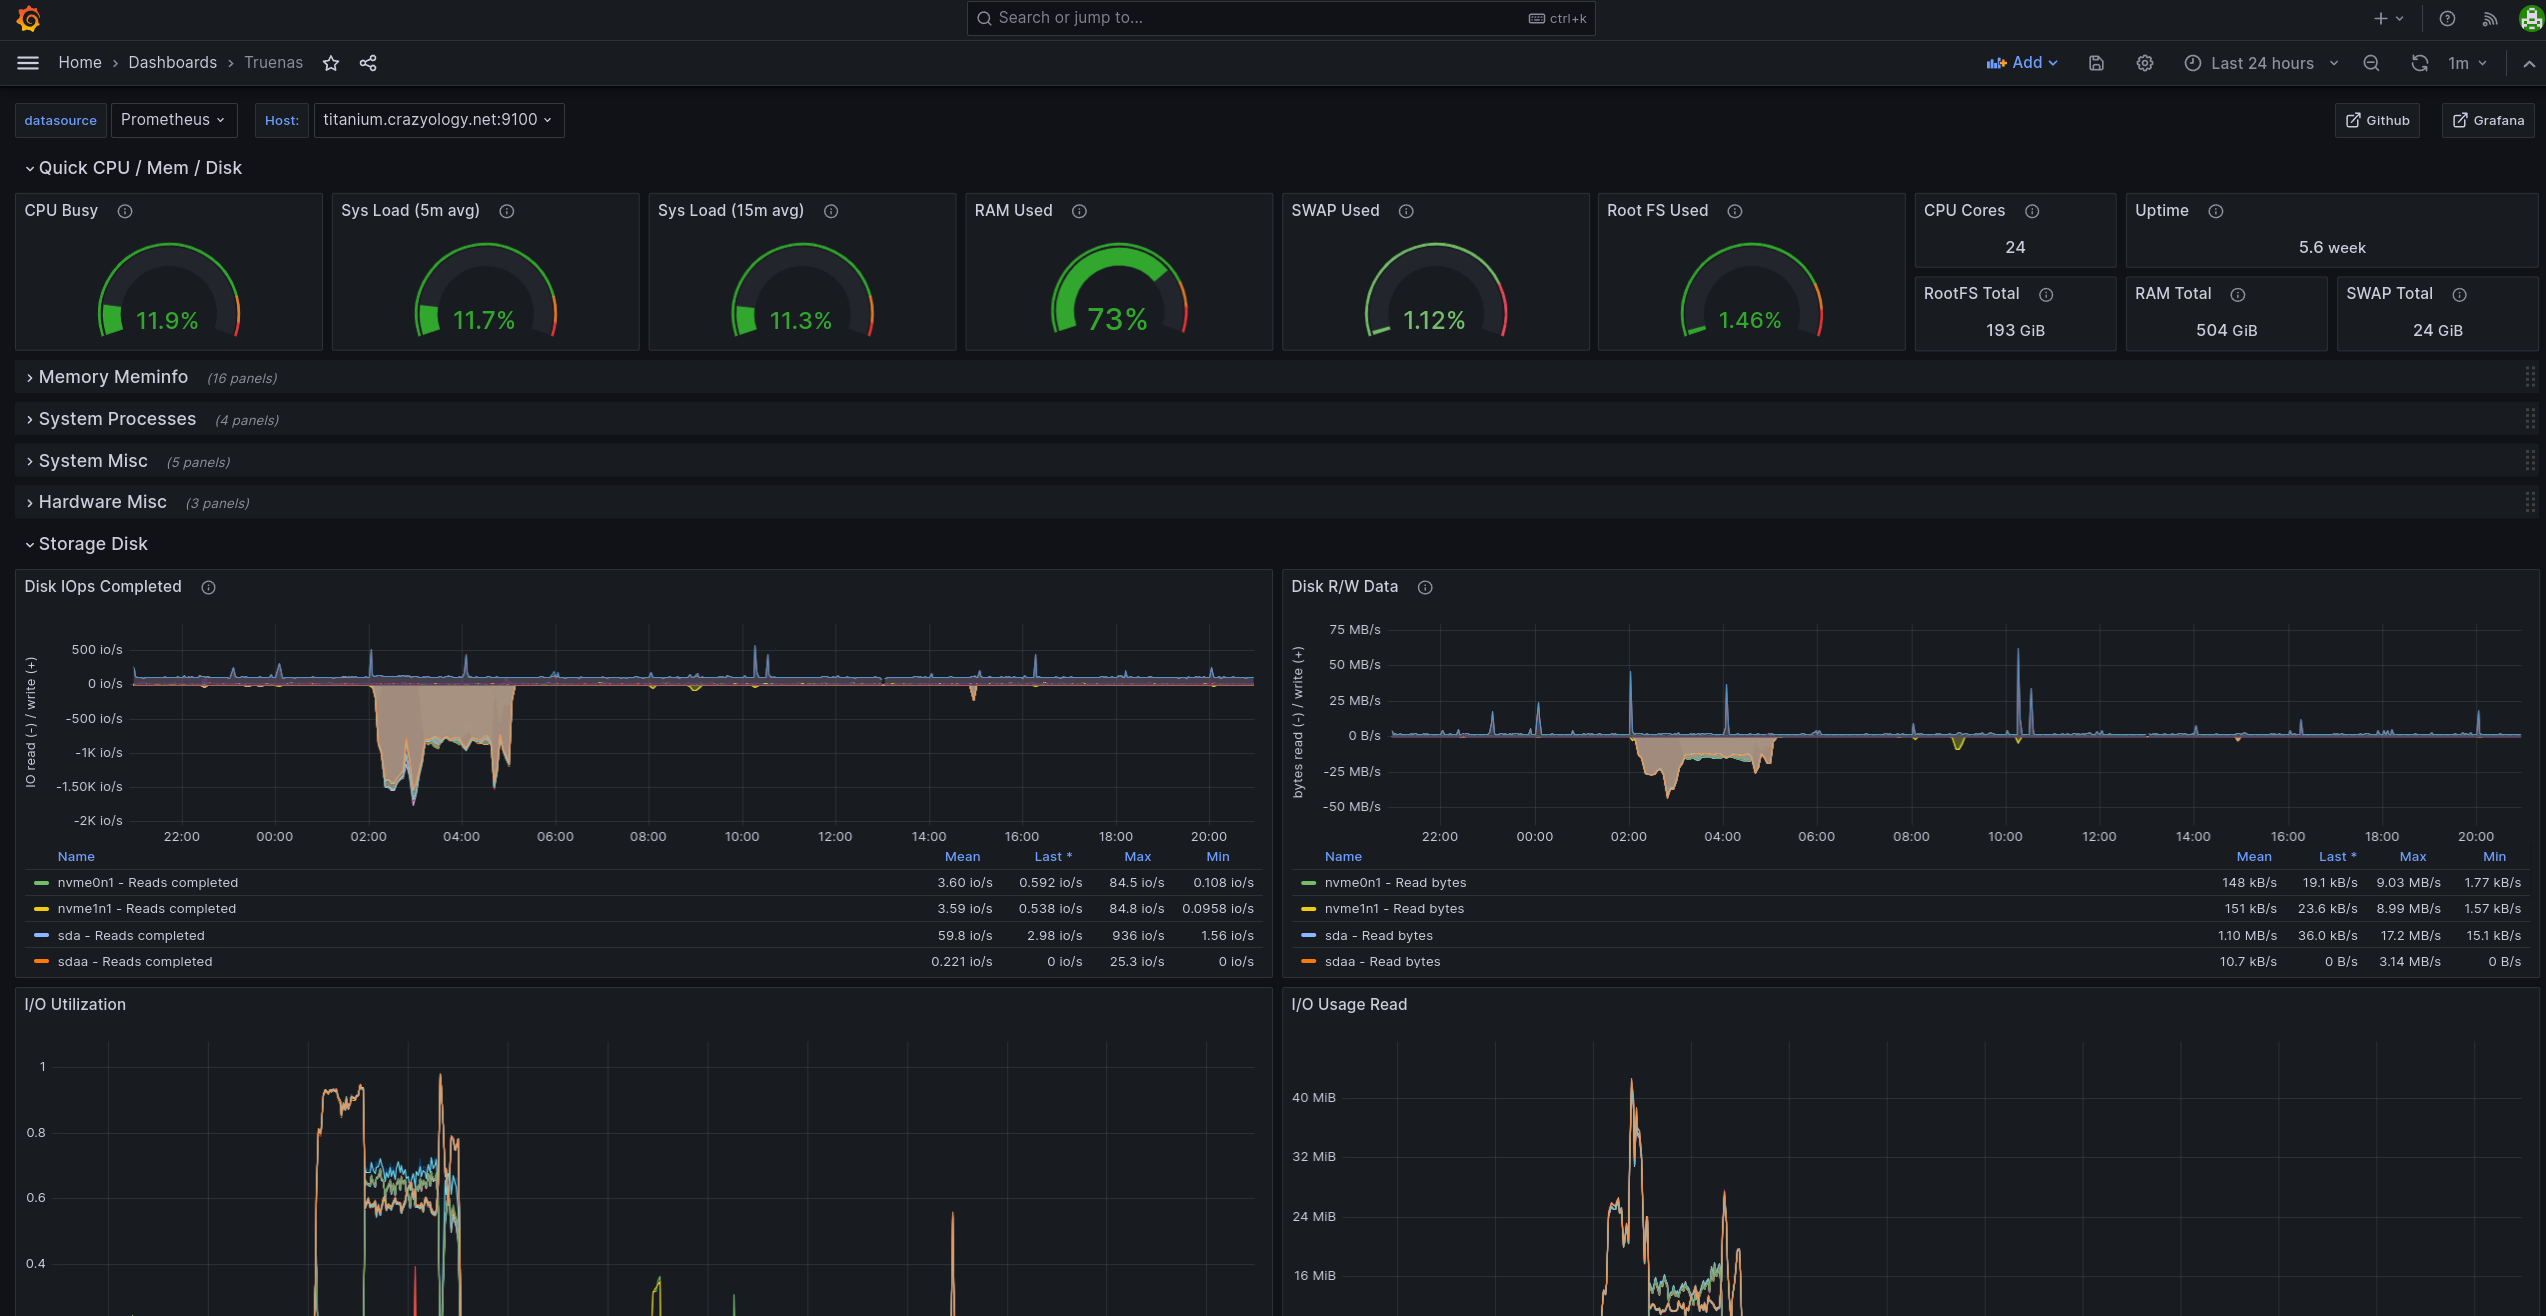
Getting Data into Grafana
On Truenas Scale
- Following exporters can be installed on truenas scale host:
- prometheus-libvirt-exporter (Default port 9177)
- prometheus-node-exporter (Default port 9100)
- prometheus-node-exporter-collector
- Disable default filesystem metrics from node-exporter by editing /etc/default/prometheus-node-exporter
ARGS="--no-collector.filesystem" - add Zfs Zpool script to /usr/share/prometheus-node-exporter-collectors and make it executable
- Create systemd files for data collections
- /lib/systemd/system/prometheus-node-exporter-zfs.service
[Unit] Description=Collect ZFS Zpool metrics for prometheus-node-exporter [Service] Type=oneshot Environment=TMPDIR=/var/lib/prometheus/node-exporter ExecStart=/bin/bash -c "/usr/share/prometheus-node-exporter-collectors/zfs_zpool.sh | sponge /var/lib/prometheus/node-exporter/zfs_zpool.prom" - /lib/systemd/system/prometheus-node-exporter-zfs.timer
[Unit]
Description=Run ZFS metrics collection every 15 minutes
ConditionPathExists=/usr/sbin/zfs
ConditionPathExists=/usr/sbin/zpool

[Timer]
OnBootSec=0
OnUnitActiveSec=15min

[Install]
WantedBy=timers.target
- /lib/systemd/system/prometheus-node-exporter-zfs.service
- Following exporters can be installed on truenas scale host:
On the Prometheus Node:
- Add Scrape Config to Prometheus
      - job_name: truenas
        static_configs:
        - targets:
            - <Truenas-scale IP/fqdn>:9100
            - <Truenas-scale IP/fqdn>:9177
Data source config
Collector type:
Collector plugins:
Collector config:
Dashboard revisions
Upload an updated version of an exported dashboard.json file from Grafana
| Revision | Decscription | Created | |
|---|---|---|---|
| Download |
Sign up for Grafana Cloud

Get up and running in minutes with the Grafana Cloud free tier, which includes free forever 10k metrics, 50GB logs, 50GB traces, 500 VUh, and more.
Get this dashboard
Data source:
Dependencies: