Influx metrics
Dashboard for displaying basic host metrics collected by telegraf and stored into the InfluxDB 2.0. Metrics are fetched by flux.
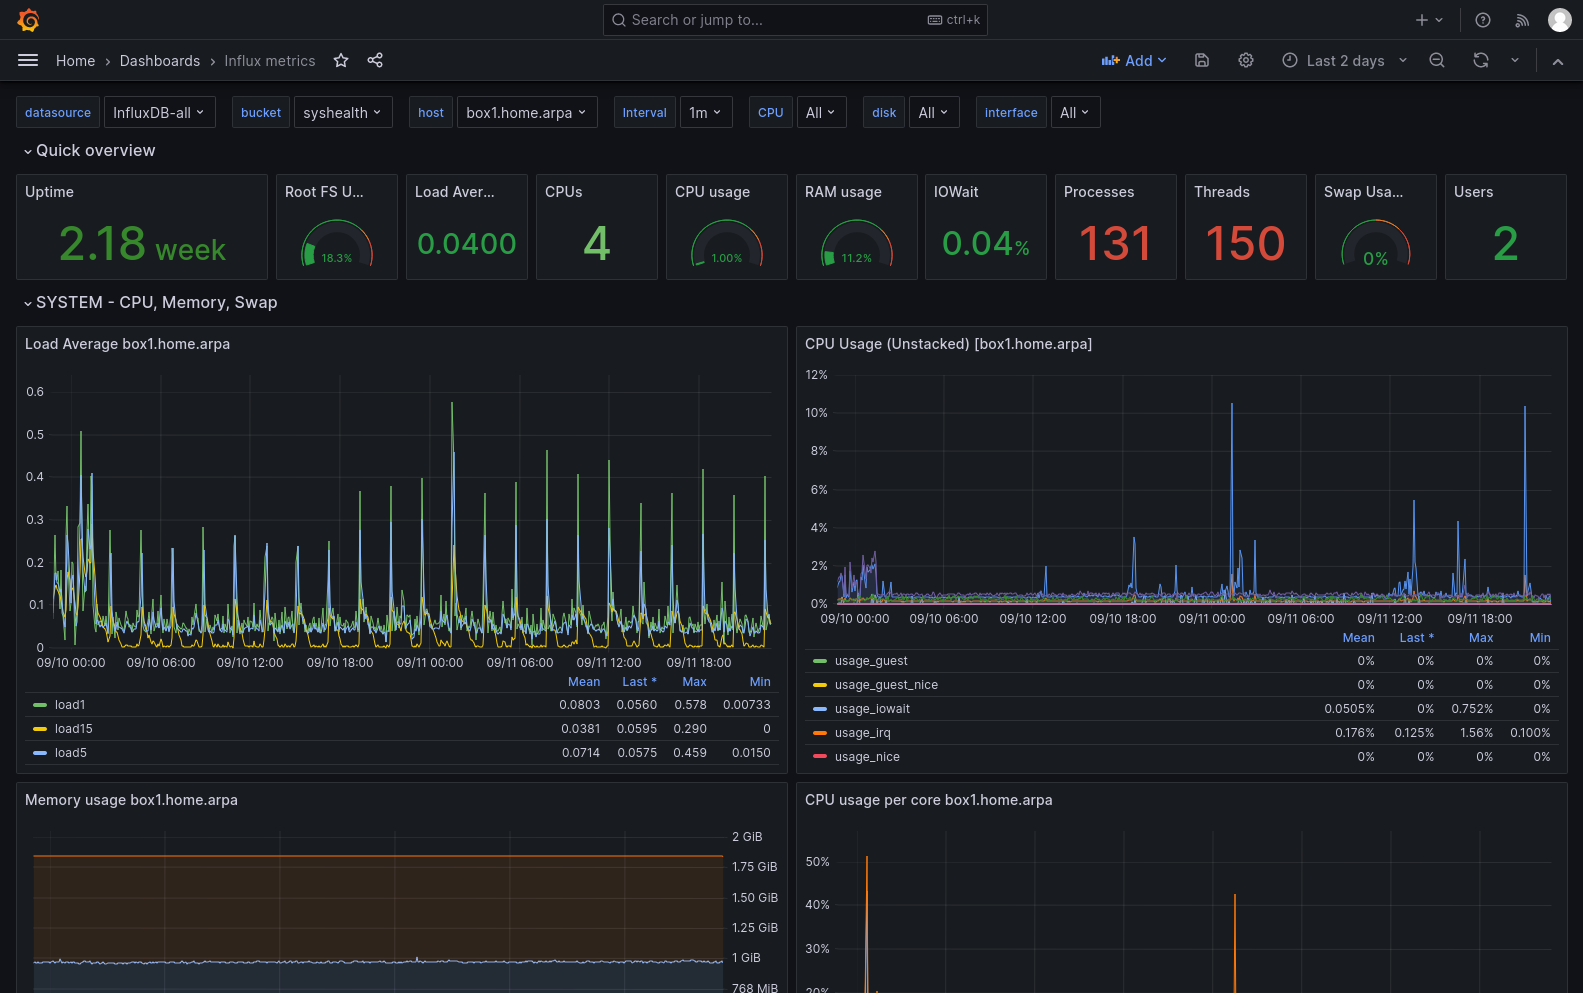
Based on https://grafana.com/grafana/dashboards/15650-telegraf-influxdb-2-0-flux/
With some updates.
When possible - merged flux queries to speed up the querying and displaying.
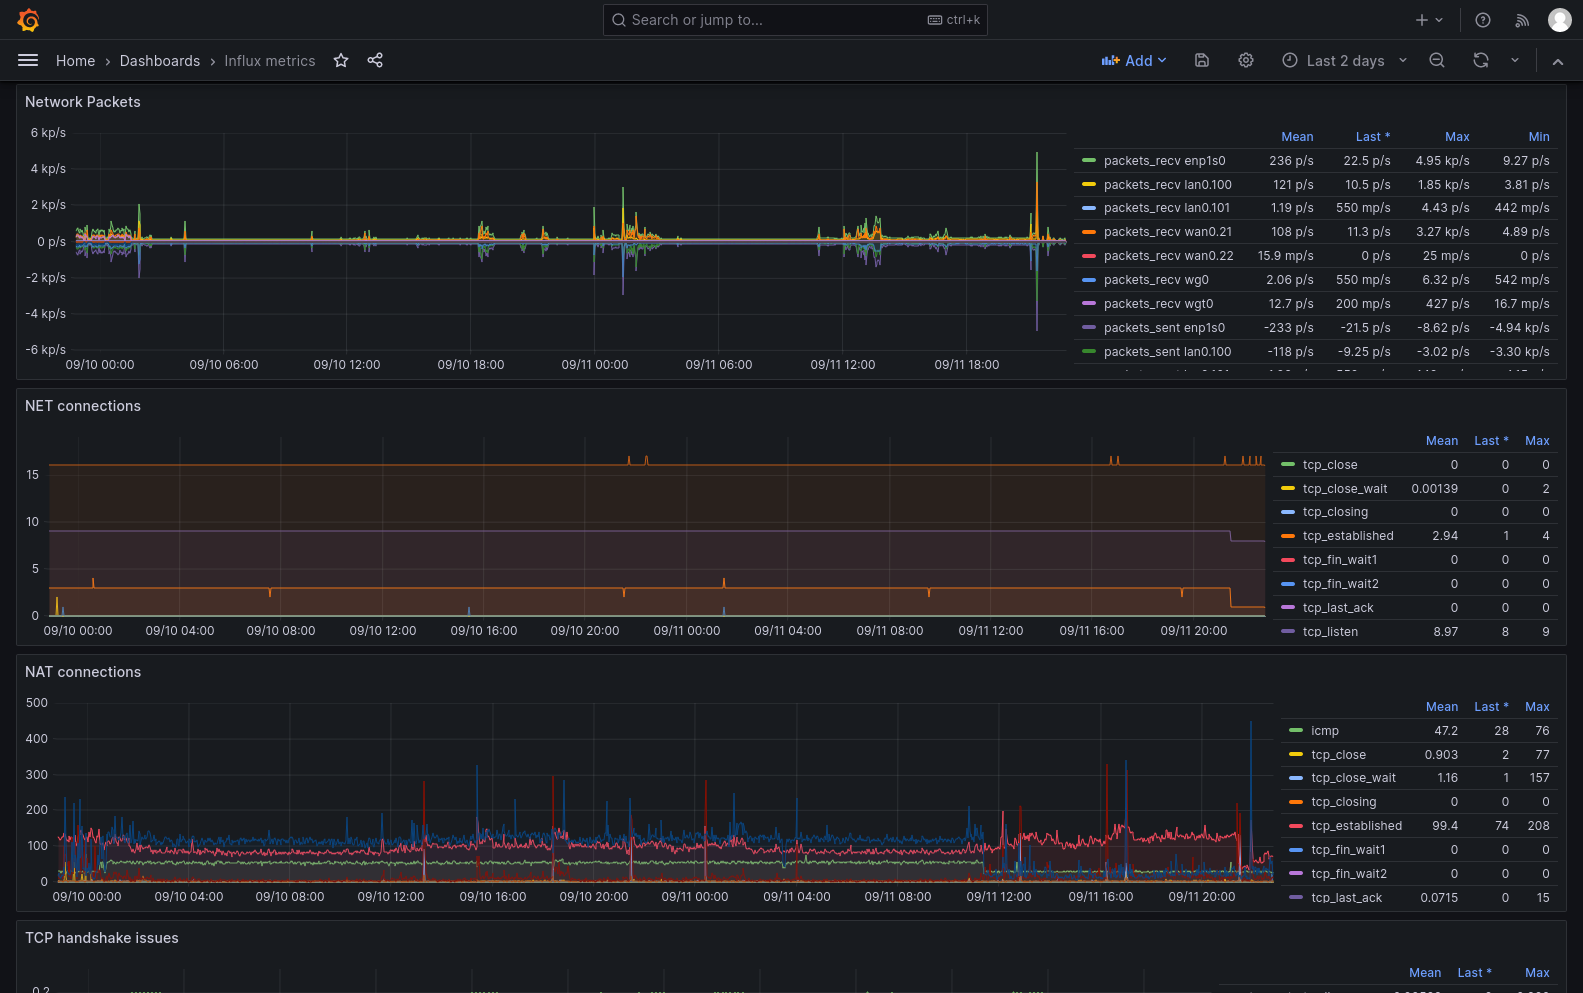
Added new panel with displaying the NAT connections.
Data source config
Collector type:
Collector plugins:
Collector config:
Revisions
Upload an updated version of an exported dashboard.json file from Grafana
| Revision | Description | Created | |
|---|---|---|---|
| Download |