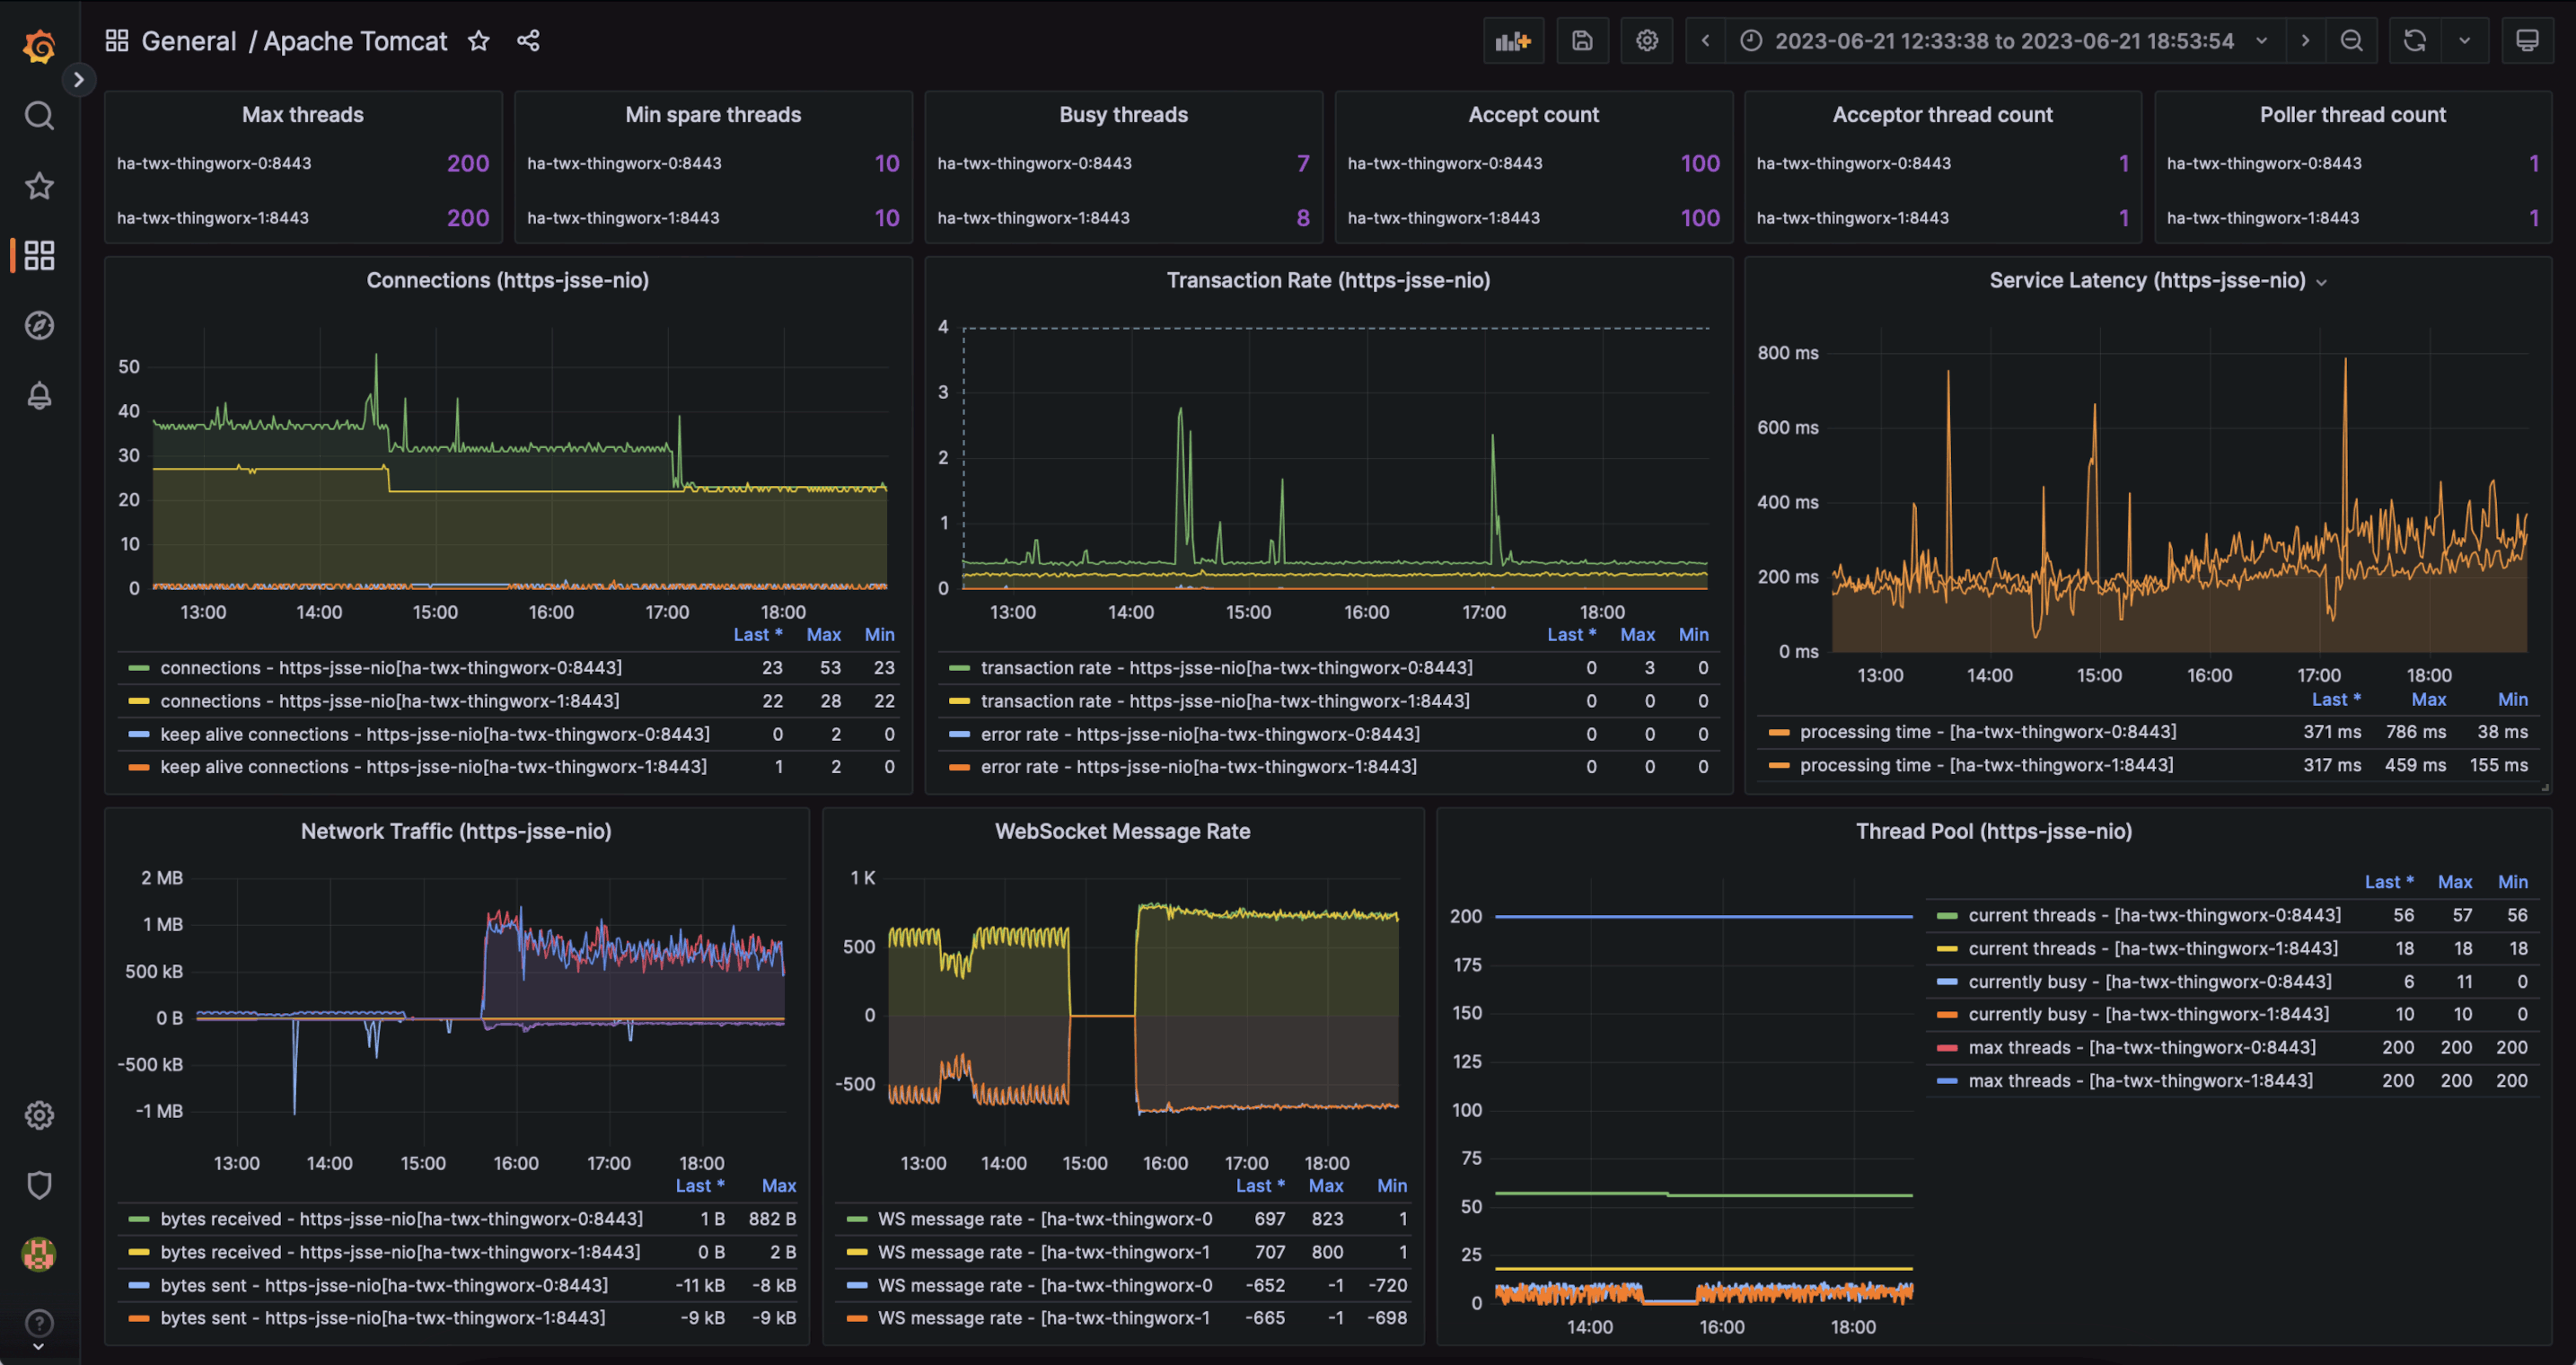
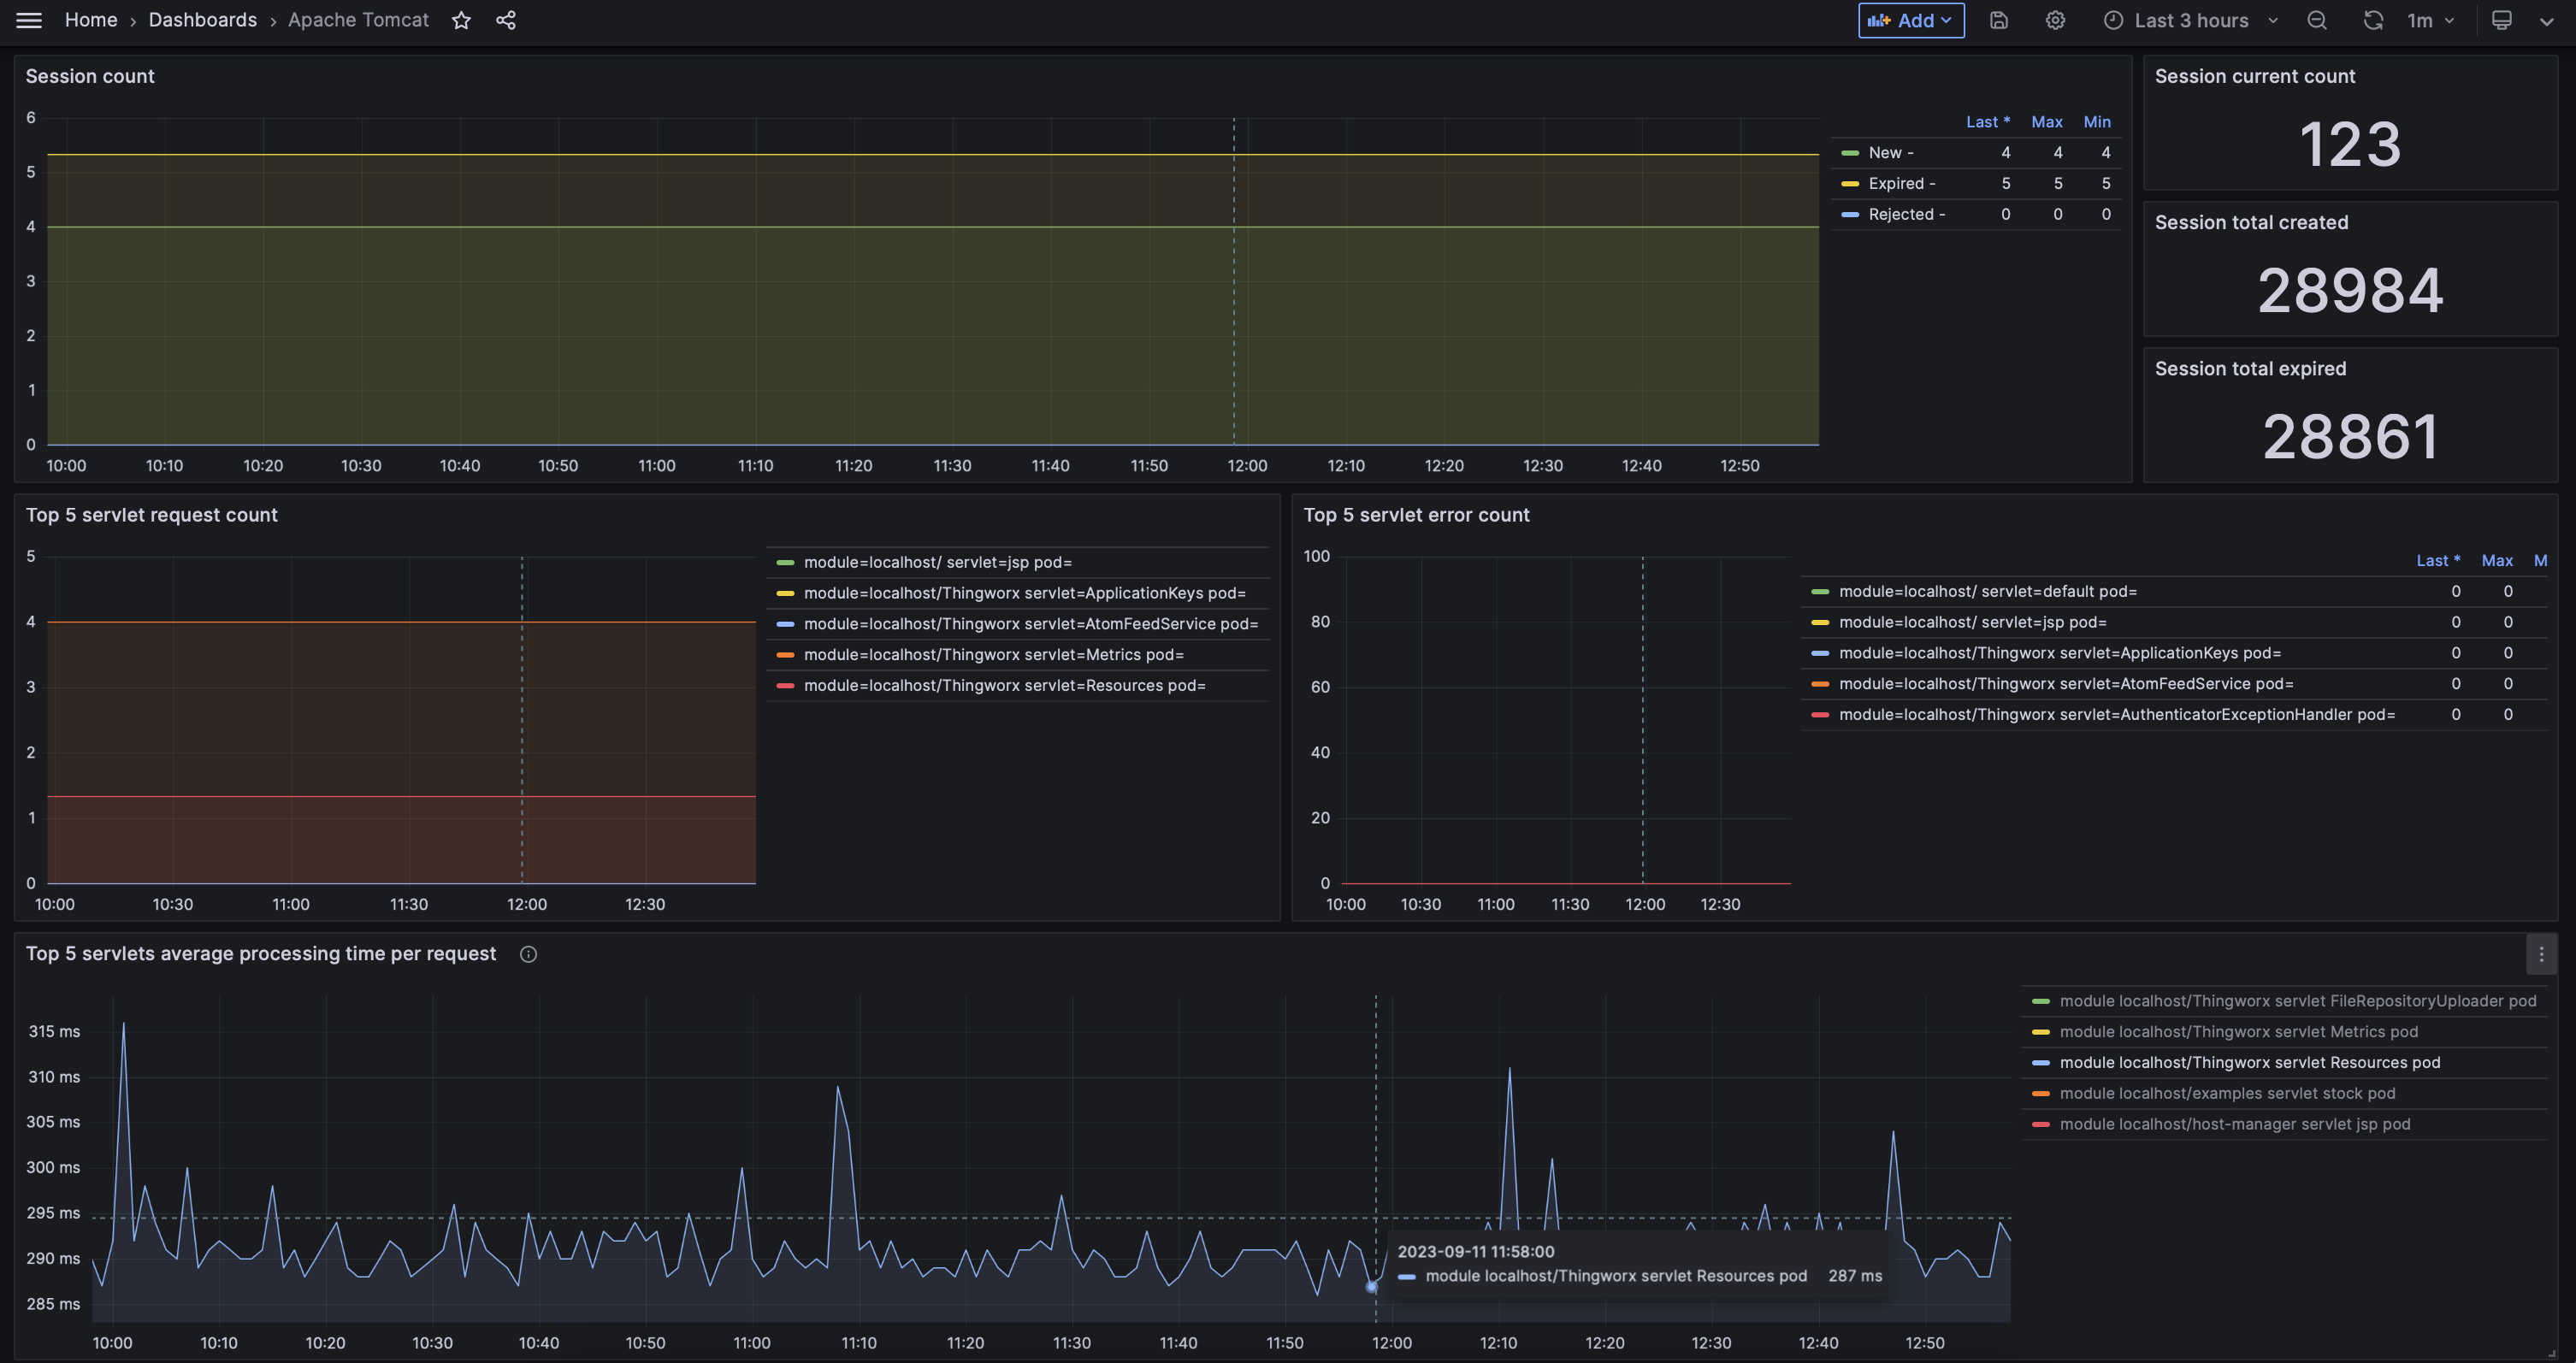
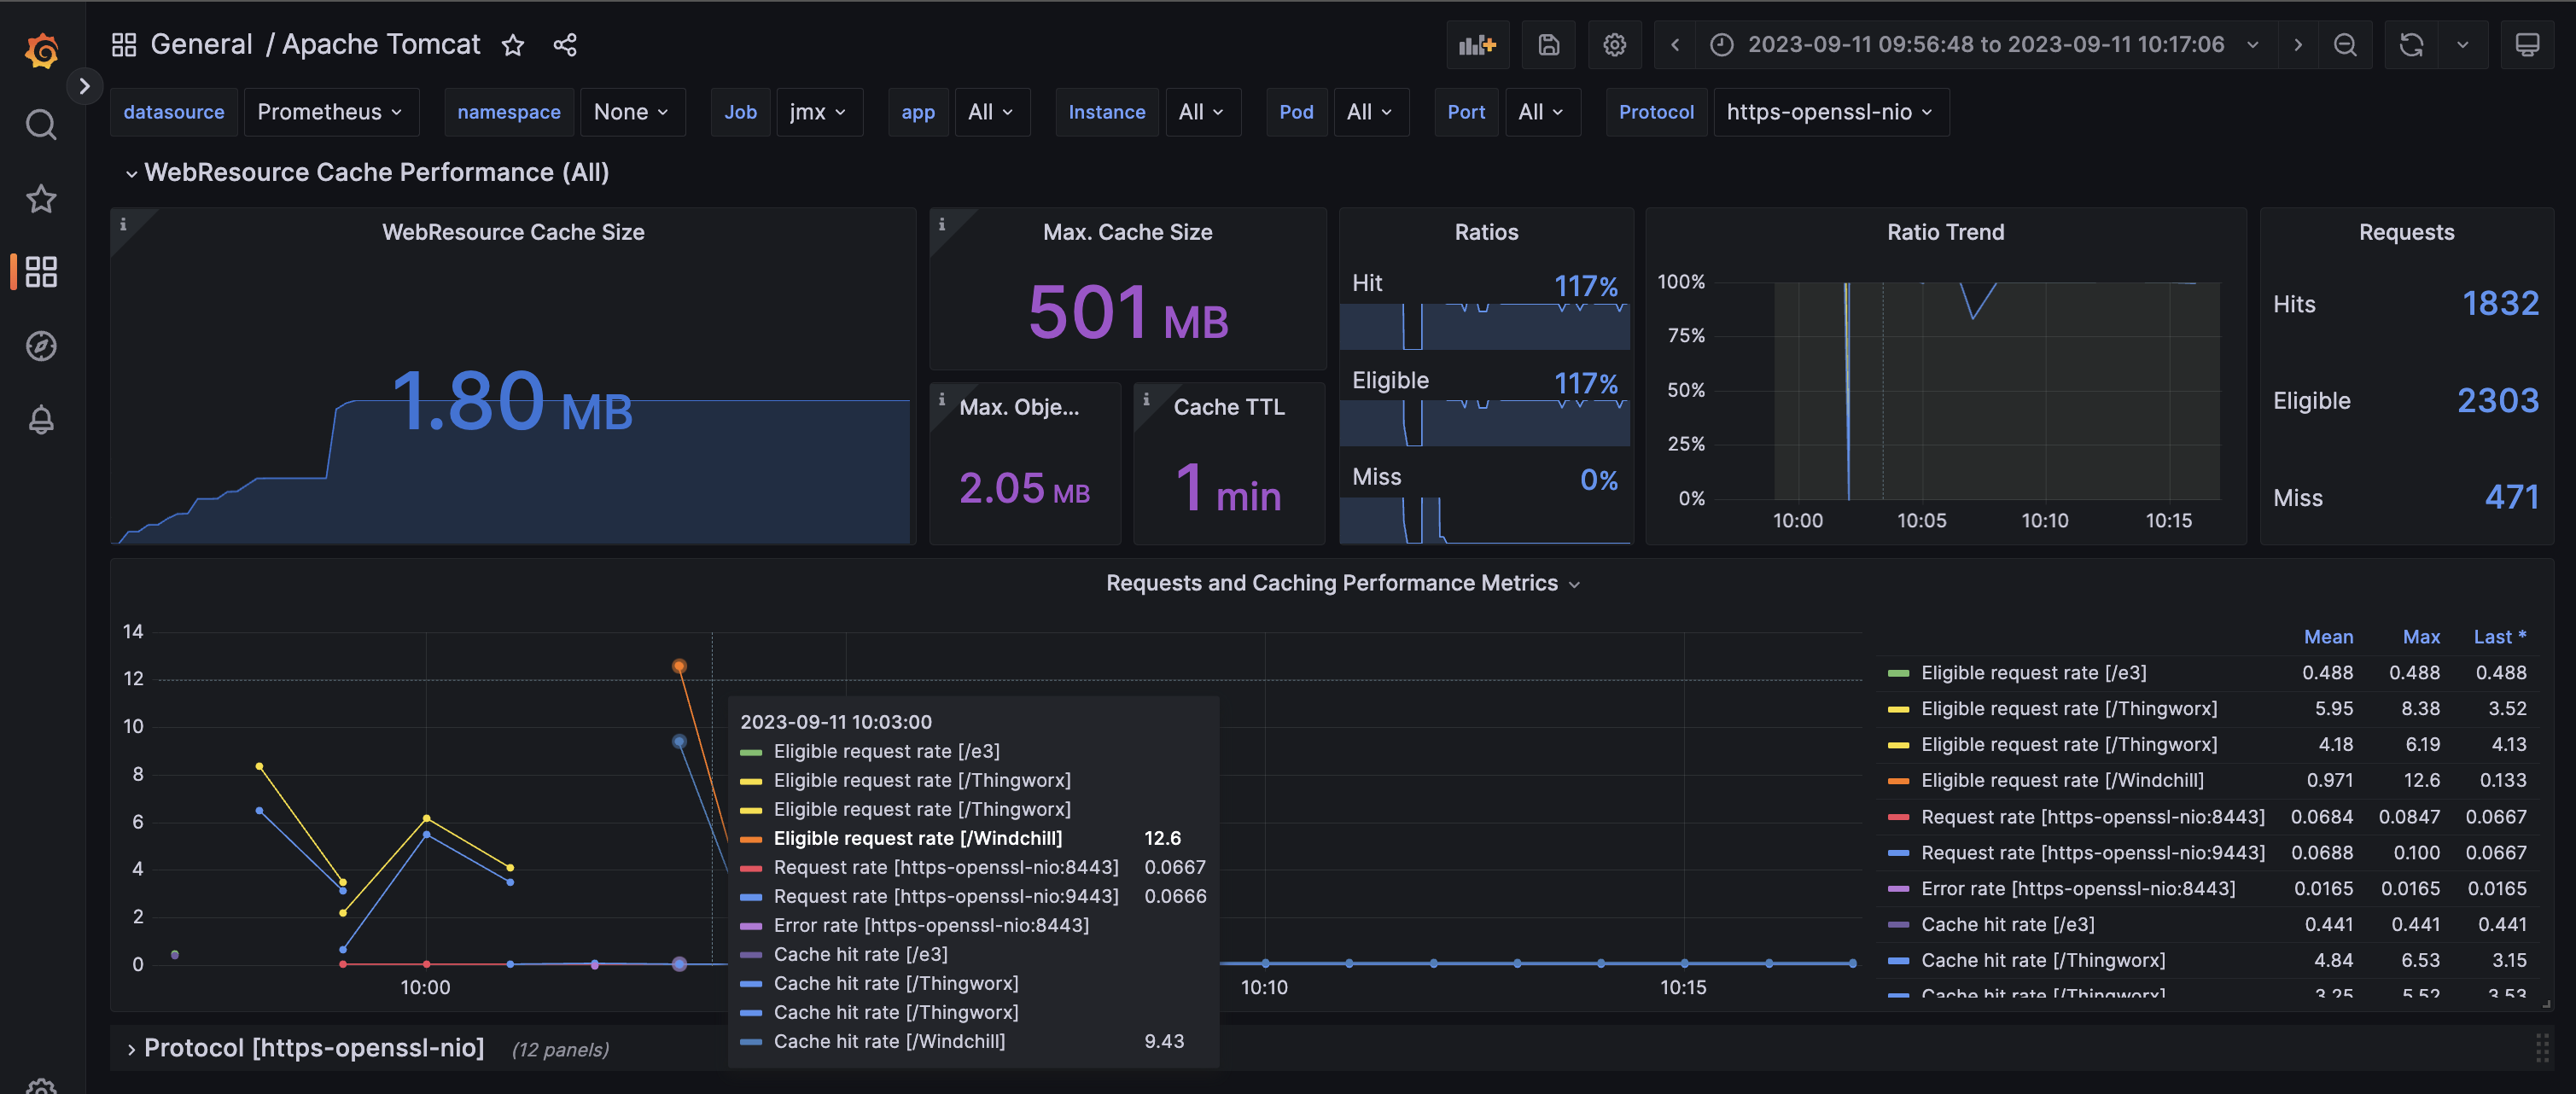
Apache Tomcat
Tomcat dashboard using metrics from prometheus JMX exporter, with drill down per job > instance
---
# Configuration by Greg Eva (geva@ptc.com) - please contact for questions or suggested changes/enhancements
lowercaseOutputLabelNames: false
lowercaseOutputName: true
# Eventually could put back whitelist, however are very specifically pulling only relevant attributes anyway
#whitelistObjectNames: ["java.lang:type=OperatingSystem", "java.lang:type=Memory", "java.lang:type=MemoryPool", "java.lang:type=Threading", "java.lang:type=GarbageCollector", "Catalina:*", "com.mchange.v2.c3p0:*" , "org.apache.commons.pool2:*"]
#blacklistObjectNames: []

rules:
## JAVA VIRTUAL MACHINE ##
- pattern: 'java.lang<type=OperatingSystem><>(ProcessCpuLoad|SystemCpuLoad|SystemLoadAverage|AvailableProcessors):'
  name: jvm_processor_$1
  help: Java Virtual Machine processor load for $1
  type: GAUGE

- pattern: 'java.lang<type=OperatingSystem><>(\w+)FileDescriptorCount:'
  name: jvm_filedescriptor_$1_count
  help: Java Virtual Machine open and maximum file descriptors
  type: GAUGE

- pattern: 'java.lang<type=OperatingSystem><>(TotalSwapSpace|FreeSwapSpace|TotalPhysicalMemorySize|FreePhysicalMemorySize):'
  name: jvm_memory_$1_bytes
  help: Java Virtual Machine memory for $1
  type: GAUGE

- pattern: 'java.lang<type=Threading><>(CurrentThreadCpuTime|CurrentThreadUserTime):'
  name: jvm_threads_$1_total
  help: Java Virtual Machine threads for $1
  type: COUNTER

- pattern: 'java.lang<type=Memory><(\w+)MemoryUsage>(\w+): (\d+)'
  name: jvm_memory_bytes_$2
  labels:
    area: "$1"  # Heap/NonHeap
    value: $3
  type: GAUGE

# Skipping GC related metrics, as they come in with the Java agent exporter implementation (not HTTP server)
# Ideally I would like these two metrics, but I cannot get the JMX query to work
# LastGcInfo before and after memory details not needed as present on jvm_memory_pool_allocated_bytes_total
#- pattern: 'java.lang<name=([-a-zA-Z0-9+/$%~_-|!.]*),type=GarbageCollector><LastGcInfo>(GcThreadCount|duration)'
#  name: jvm_gc_$2
#  labels:
#    pool: $1
#  help: Java Virtual Machine garbage collection for $1
#  type: GAUGE

## TOMCAT ##
- pattern: 'Catalina<type=GlobalRequestProcessor, name=\"(\w+-.+?)-(\d+)\"><>(\w+):'
  name: tomcat_$3_total
  labels:
    port: "$2"
    protocol: "$1"
  help: Tomcat global $3
  type: COUNTER

- pattern: 'Catalina<type=GlobalRequestProcessor, Upgrade=([-a-zA-Z0-9+/$%~_-|!.]*), name=\"(\w+-.+?)-(\d+)\"><>(\w+):'
  name: tomcat_upgrade_$4_total
  labels:
    port: "$2"
    protocol: "$1"
    upgrade: "$3"
  help: Tomcat global $4
  type: COUNTER

- pattern: 'Catalina<j2eeType=Servlet, WebModule=//([-a-zA-Z0-9+&@#/%?=~_|!:.,;]*[-a-zA-Z0-9+&@#/%=~_|]), name=([-a-zA-Z0-9+/$%~_-|!.]*), J2EEApplication=none, J2EEServer=none><>(requestCount|maxTime|processingTime|errorCount):'
  name: tomcat_servlet_$3_total
  labels:
    module: "$1"
    servlet: "$2"
  help: Tomcat servlet $3 total
  type: COUNTER

- pattern: 'Catalina<type=ThreadPool, name="(\w+-.+?)-(\d+)"><>(currentThreadCount|currentThreadsBusy|keepAliveCount|maxKeepAliveRequests|pollerThreadCount|connectionCount|maxConnections|connectionTimeout|maxThreads|minSpareThreads|acceptCount|acceptorThreadCount):'
  name: tomcat_threadpool_$3
  labels:
    port: "$2"
    protocol: "$1"
  help: Tomcat threadpool $3
  type: GAUGE

- pattern: 'Catalina<type=Manager, host=([-a-zA-Z0-9+&@#/%?=~_|!:.,;]*[-a-zA-Z0-9+&@#/%=~_|]), context=([-a-zA-Z0-9+/$%~_-|!.]*)><>(processingTime|sessionCounter|rejectedSessions|expiredSessions):'
  # (Catalina<j2eeType=Servlet, WebModule=//localhost/examples, name=stock, J2EEApplication=none, J2EEServer=none><>asyncSupported)
  name: tomcat_session_$3_total
  labels:
    context: "$2"
    host: "$1"
  help: Tomcat session $3 total
  type: COUNTER

- pattern: 'Catalina<type=WebResourceRoot, host=([-a-zA-Z0-9+&@#/%?=~_|!:.,;]*[-a-zA-Z0-9+&@#/%=~_|]), context=([-a-zA-Z0-9+/$%~_-|!.]*), name=Cache><>(\w+):'
  name: tomcat_cache_$3
  labels:
    context: "$2"
    host: "$1"
  help: Tomcat Resource cache confirguration and performance metrics (units are kb and ms)
  type: GAUGE

# For everything missing... compatibility across MSAI deployments and my own dashboards.
#- pattern: "java.*"
- pattern: "Catalina*"
You will then need to either change your Tomcat service to include the JMX Exporter as a Java agent, or add it to the JAVA_OPTS or CATALINA_OPTS so that the exporter with associated configuration file will be loaded with Tomcat.
-javaagent:/opt/jmx_exporter/jmx_prometheus_javaagent-0.20.0.jar=9111:/opt/jmx_exporter/jmx-exporter-config-tomcat.yaml
And then add the relevant Prometheus scrape configuration for the above JMX Exporter configuration. Consult the Prometheus documentation should you need to enhance it.
  - job_name: 'jmx'
static_configs:
- targets: ['wer-twx-foundation:9111', 'wer-twx-iothubconnector:9111']
You'll note the YAML list which allows adding multiple servers to scrape. You can break these out across multiple lines if you wish to apply specific application or other labels as a part of the scrape. Example:
    - targets:
      - simulator.japaneast.cloudapp.azure.com:9111
      labels:
        group: Simulators
        region: Japan
    - targets:
      - simulator.centralus.cloudapp.azure.com:9111
      labels:
        group: Simulators
        region: USA
    - targets:
      - simulator.germanywestcentral.cloudapp.azure.com:9111
      labels:
        group: Simulators
        region: Germany
    - targets:
      - simulator.koreacentral.cloudapp.azure.com:9111
      labels:
        group: Simulators
        region: Korea
Data source config
Collector config:
Upload an updated version of an exported dashboard.json file from Grafana
| Revision | Description | Created | |
|---|---|---|---|
| Download |
Apache Tomcat
Easily monitor Apache Tomcat, an open source web server and servlet container that can run Java-based web applications, with Grafana Cloud's out-of-the-box monitoring solution.
Learn more