Kubernetes / Logging / Vector
This dashboard developed with Kubernetes logging in mind.
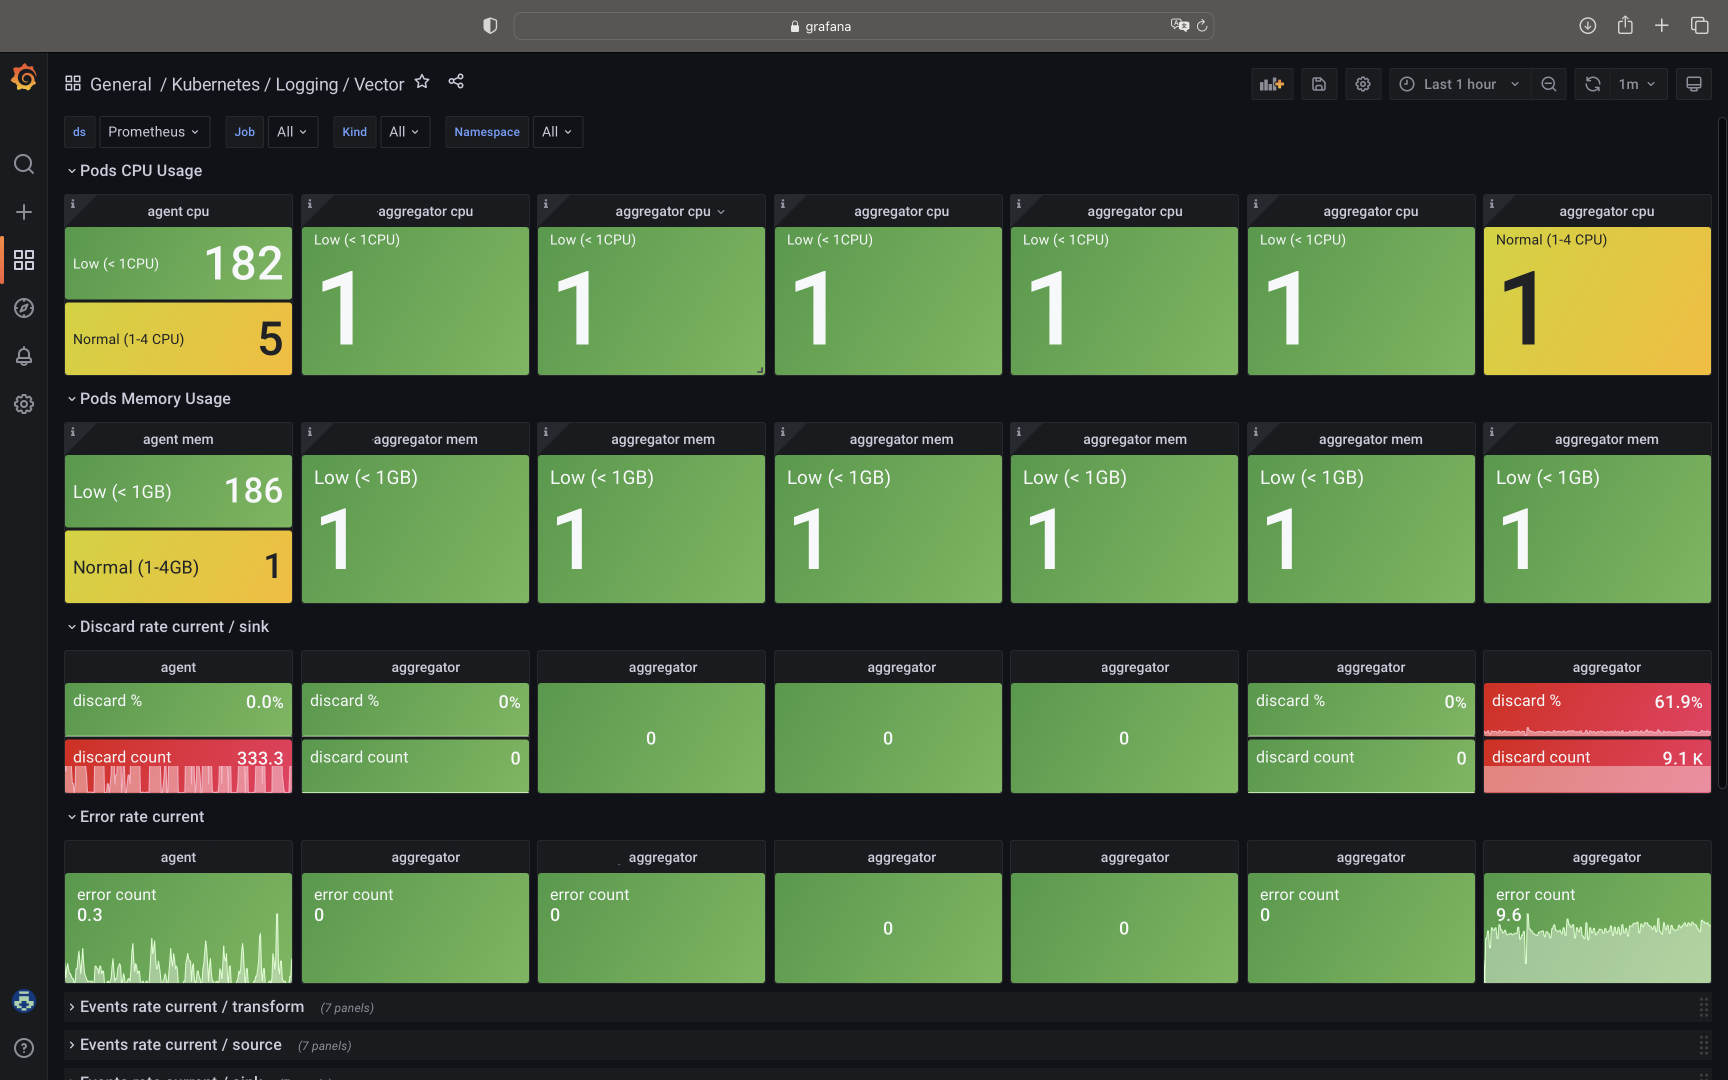
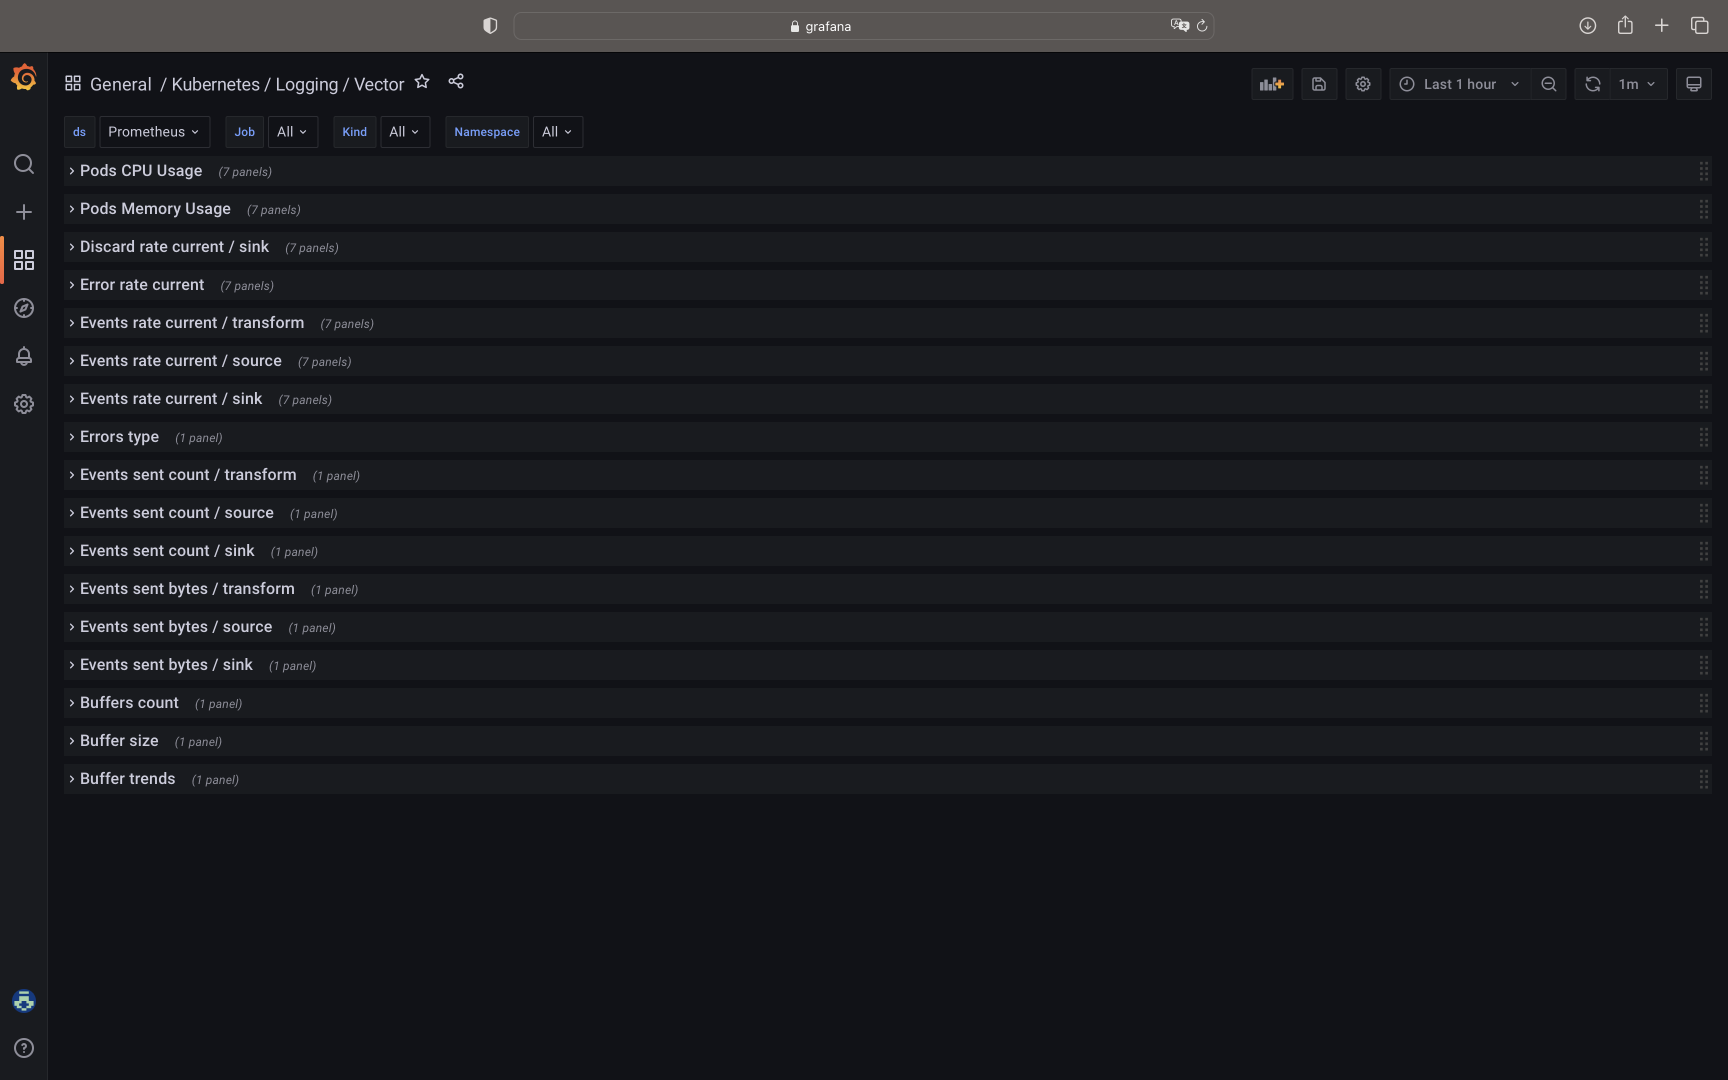
Available panels with metrics:
- Pods CPU Usage
- Pods Memory Usage
- Discard rate current / sink
- Error rate current
- Events rate current / transform
- Events rate current / source
- Events rate current / sink
- Errors type
- Events sent count / transform
- Events sent count / source
- Events sent count / sink
- Events sent bytes / transform
- Events sent bytes / source
- Events sent bytes / sink
- Buffers count
- Buffer size
- Buffer trends
Data source config
Collector type:
Collector plugins:
Collector config:
Revisions
Upload an updated version of an exported dashboard.json file from Grafana
| Revision | Description | Created | |
|---|---|---|---|
| Download |
Kubernetes
Monitor your Kubernetes deployment with prebuilt visualizations that allow you to drill down from a high-level cluster overview to pod-specific details in minutes.
Learn more