Geo-Mapping-ivan
Dashboard to show info about auth.log entries. Get newest version from github repository. Json and Exporter
Geo-Mapping-Ivan
Overview
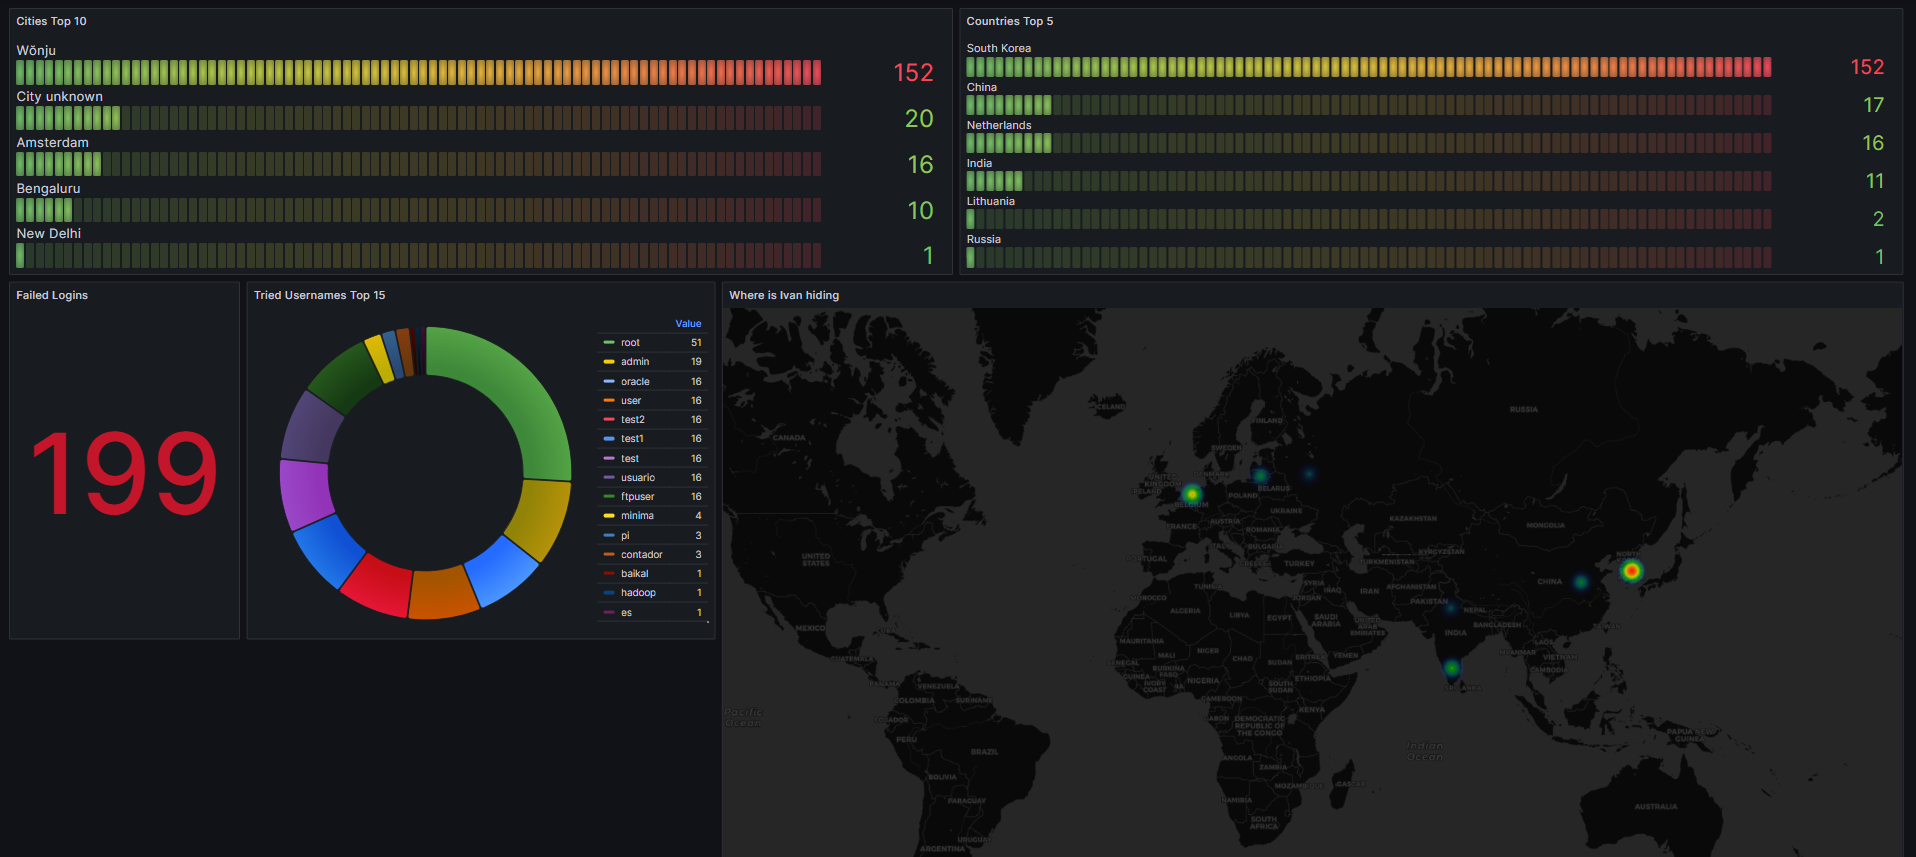
This dashboard provides insights into [brief description of what the dashboard visualizes]. It utilizes data collected from /var/log/auth.log using the Geo-Mapping-Ivan program which collects ip and username and gets geographical information through an api and presents it in a user-friendly and visually appealing manner.
Use the json from the github repository cause that's the newest.
Features
- show most tried usernames
- show most attack origin countries
- show markers on map based on longitued and latitude
Usage
To use this dashboard, follow these steps:
Data Source Configuration: Ensure that you have configured your data source prometheus in Grafana. The dashboard is designed to work with this specific data source.
Dashboard Import: Copy the JSON file or the ID
- Go to your Grafana instance.
- Click on the '+' icon on the left sidebar to open the "Create" menu.
- Select "Import" to open the Import Dashboard page.
- Click on the "Upload .json File" button and select the downloaded dashboard.json file.
- Configure the data source for the imported dashboard to match your [data source].
- Click on "Import" to finalize the dashboard import.
Customization: Once the dashboard is imported, you can customize it further to match your preferences and requirements. You can modify panels, adjust time ranges, and add more visualizations as needed.
Additional Information
- Author: whosfritz
- License: MIT License
- Contact: Fritz.Schubert@whosfritz.de
License
This dashboard is licensed under the MIT License. You are free to use, modify, and distribute it according to the terms of the license.
Acknowledgments
Data source config
Collector config:
Upload an updated version of an exported dashboard.json file from Grafana
| Revision | Description | Created | |
|---|---|---|---|
| Download |