vSAN Capacity
Dashboard with vSAN capacity data pulled from vCenter with Telegraf
This dashboard uses Telegraf version 1.27 or newer to pull vSAN metrics from a VMware vCenter server with the Telegraf vSphere input plugin. The Influx database used is on version 1.x
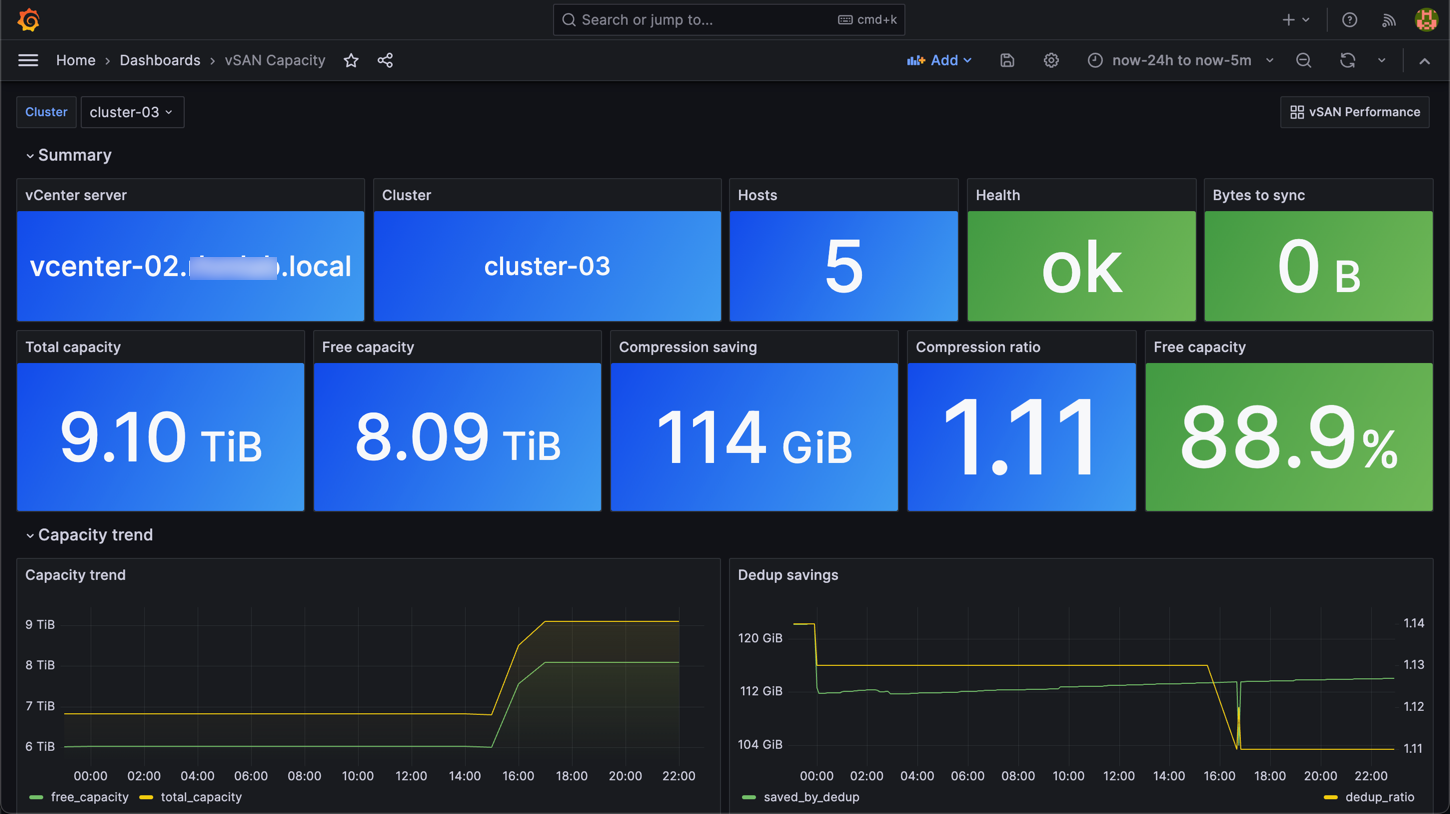
The dashboard presents vSAN capacity data found on a vSAN cluster in vCenter.
Note that the Telegraf agent is configured with two vSphere input plugins. One for the "summary" data which is logged on 60 second intervals, and one for the "performance" data which is rolled up every 5 minutes.
For more information about configuring the vSphere plugin please refer to the documentation
Data source config
Collector type:
Collector plugins:
Collector config:
Revisions
Upload an updated version of an exported dashboard.json file from Grafana
| Revision | Description | Created | |
|---|---|---|---|
| Download |