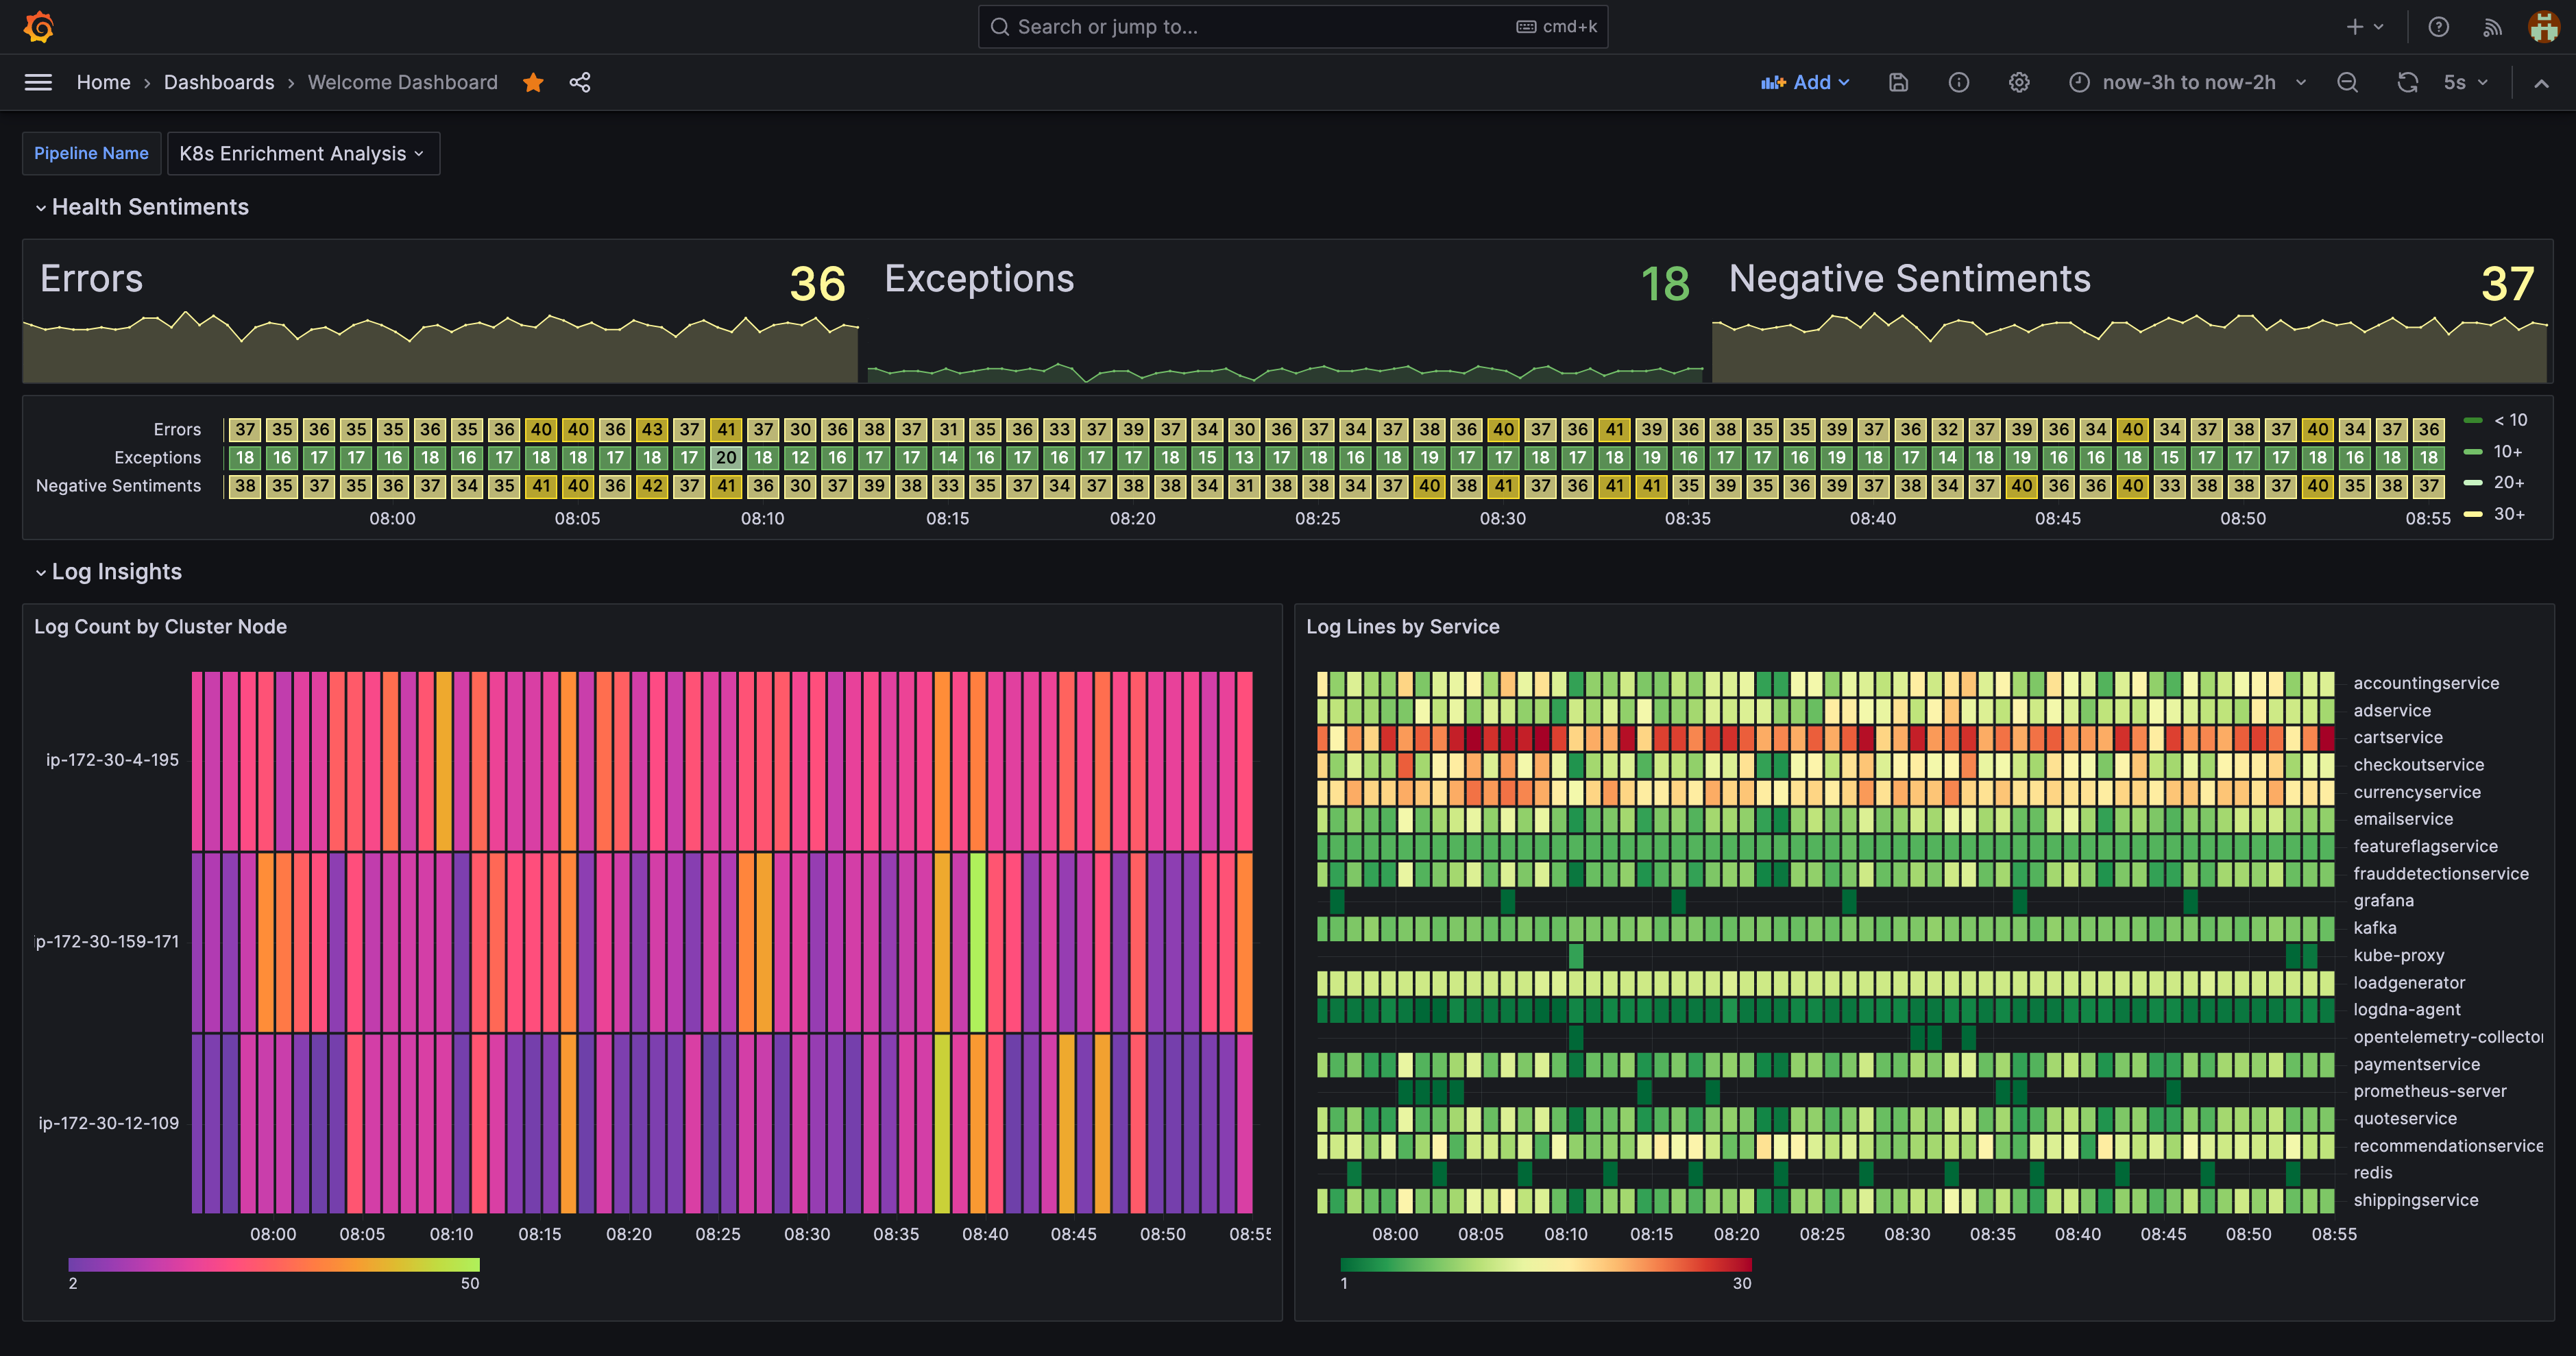
Mezmo Welcome Dashboard
As metrics, logs and traces flow out of a Kubernetes environment, they are sent directly to a telemetry pipeline endpoint which captures and processes the data in real time looking for valuable insights that can be converted to metrics and shared to a Grafana dashboard for visualization.
As metrics, logs and traces flow out of a Kubernetes environment, they are sent directly to a telemetry pipeline endpoint which captures and processes the data in real time looking for valuable insights that can be converted to metrics and shared to a Grafana dashboard for visualization.
Data source config
Collector config:
Upload an updated version of an exported dashboard.json file from Grafana
| Revision | Description | Created | |
|---|---|---|---|
| Download |

