Dashboard Monitoring All Server Overview
Creating a comprehensive dashboard that amalgamates the vital statistics of multiple servers, encompassing CPU utilization, RAM allocation, disk capacity, and various other metrics. This intricate instrumentation leverages exporters and establishes seamless connectivity with a PostgreSQL backend. This meticulously crafted dashboard finds its purpose in overseeing the health and performance of our web servers.
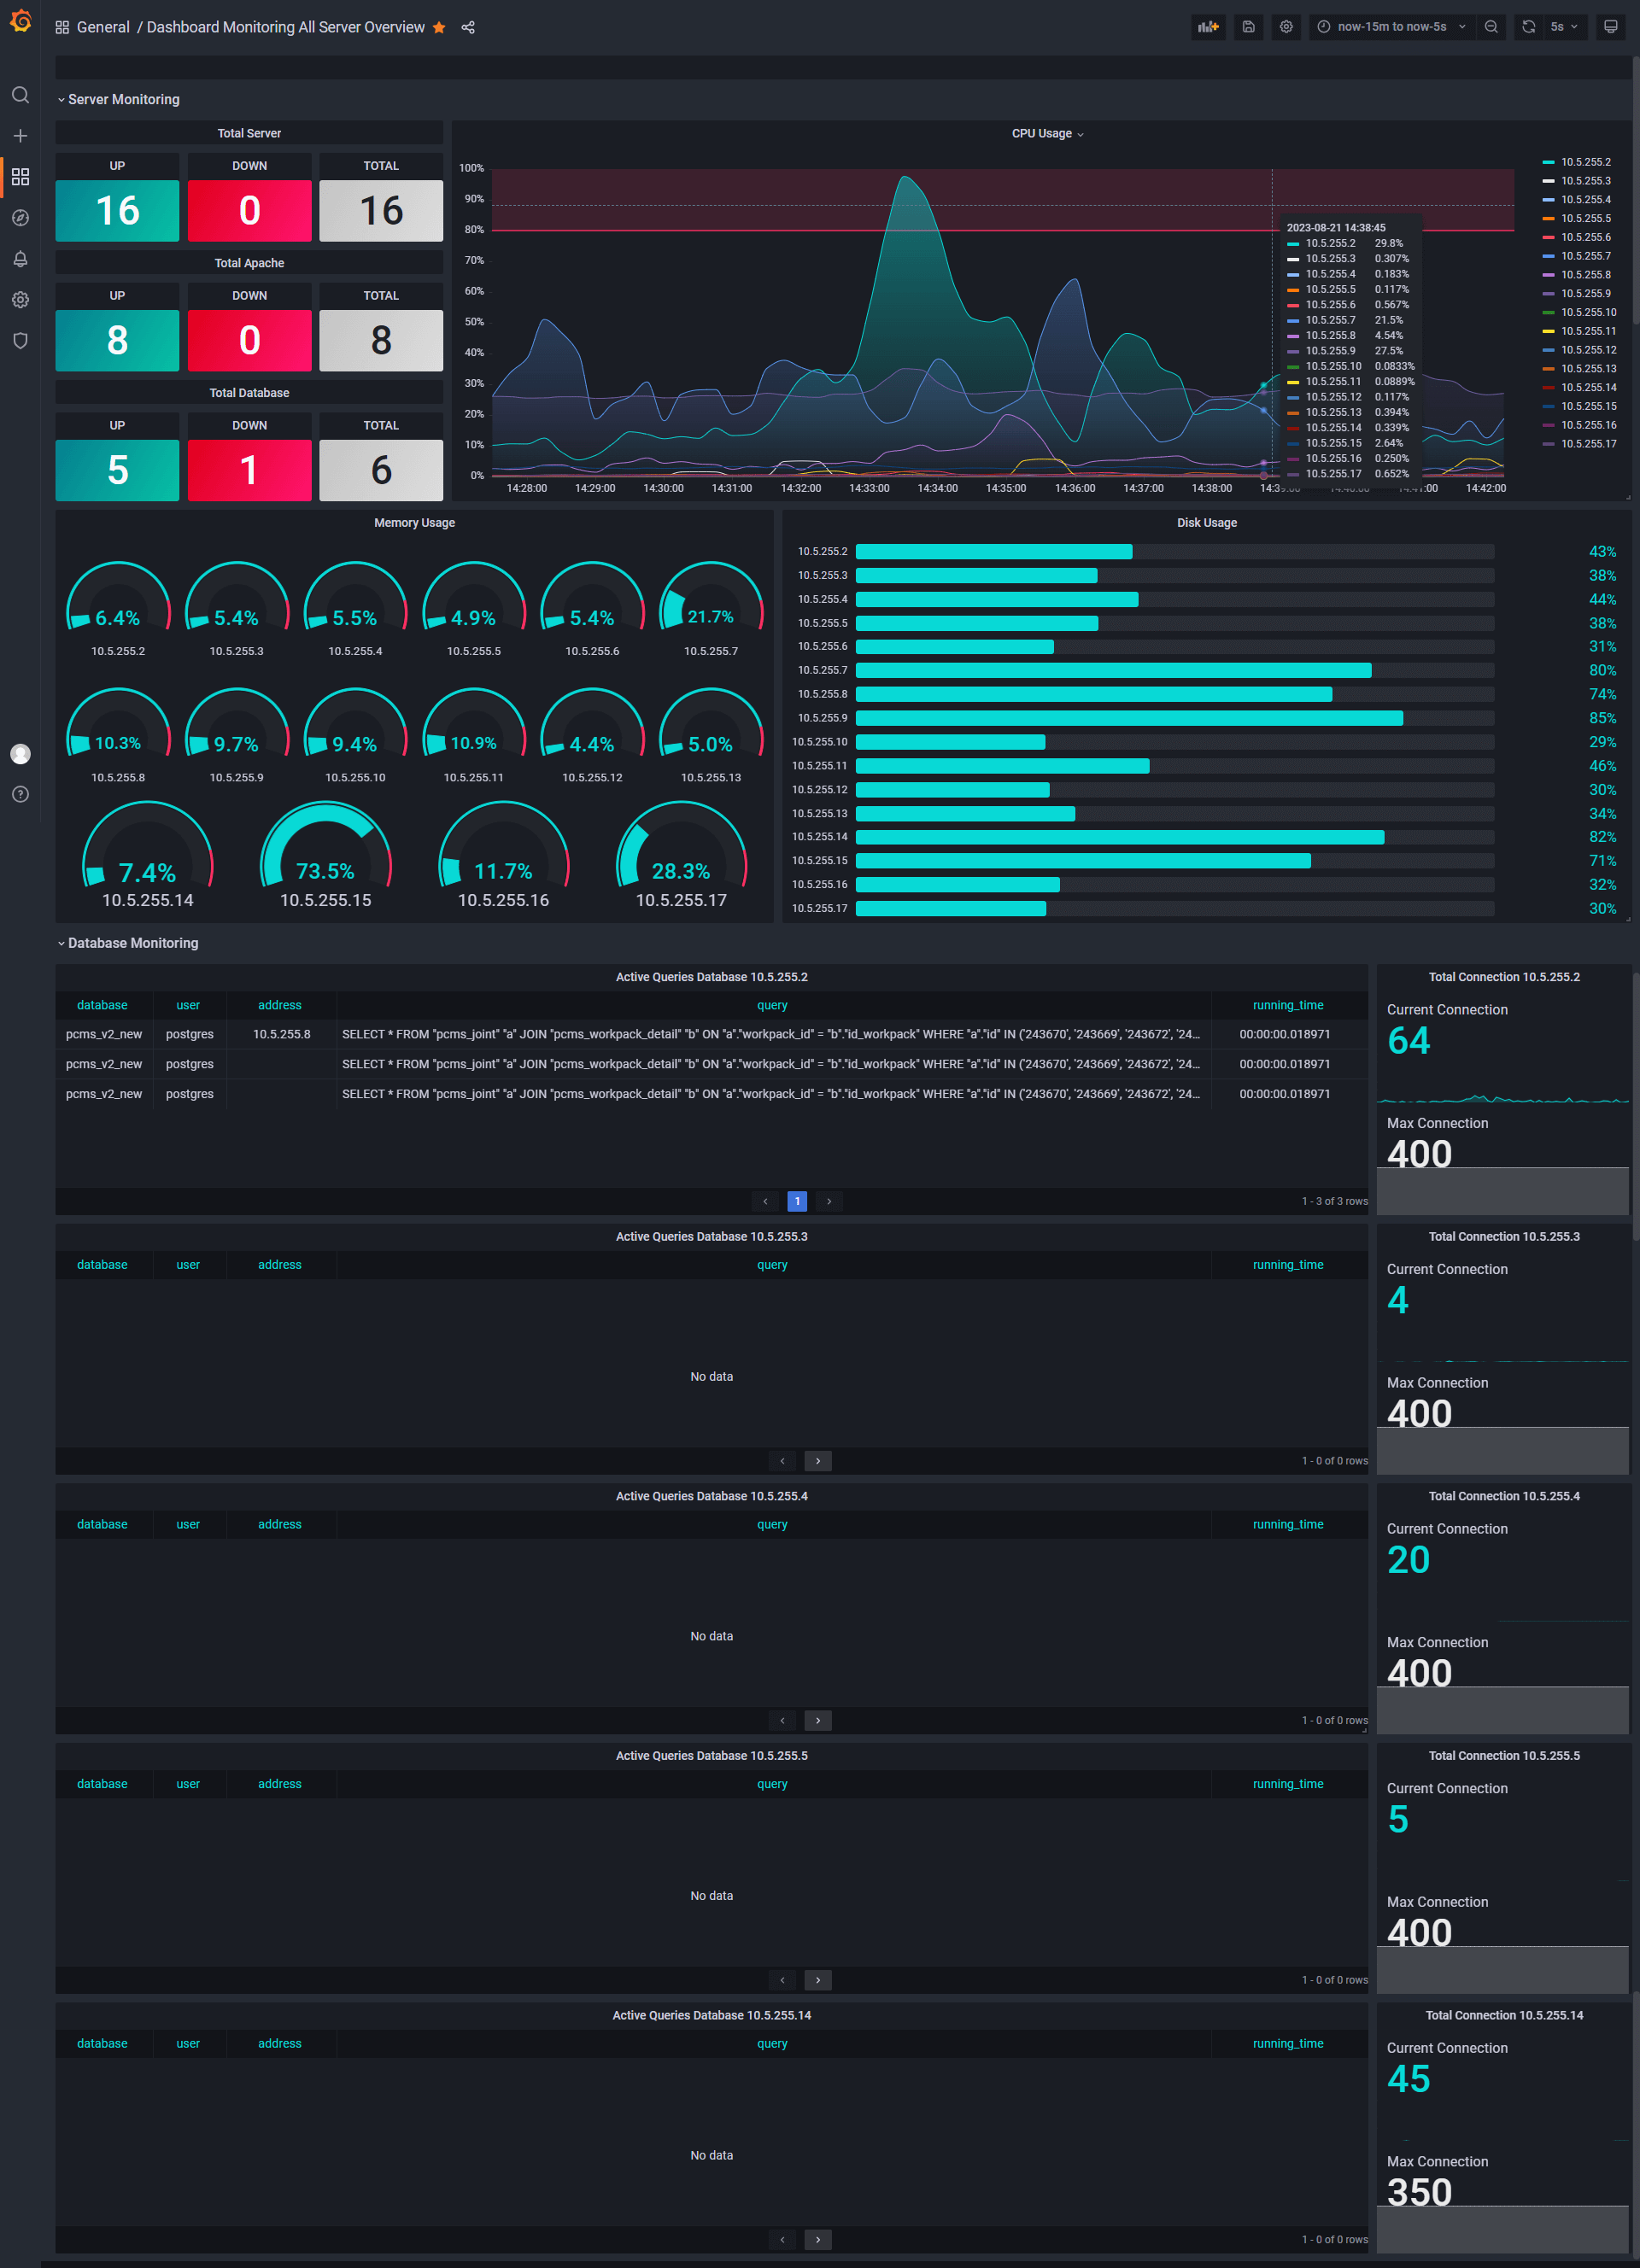
The data from metric which collected by prometheous, and connection to database
Data source config
Collector type:
Collector plugins:
Collector config:
Revisions
Upload an updated version of an exported dashboard.json file from Grafana
| Revision | Description | Created | |
|---|---|---|---|
| Download |