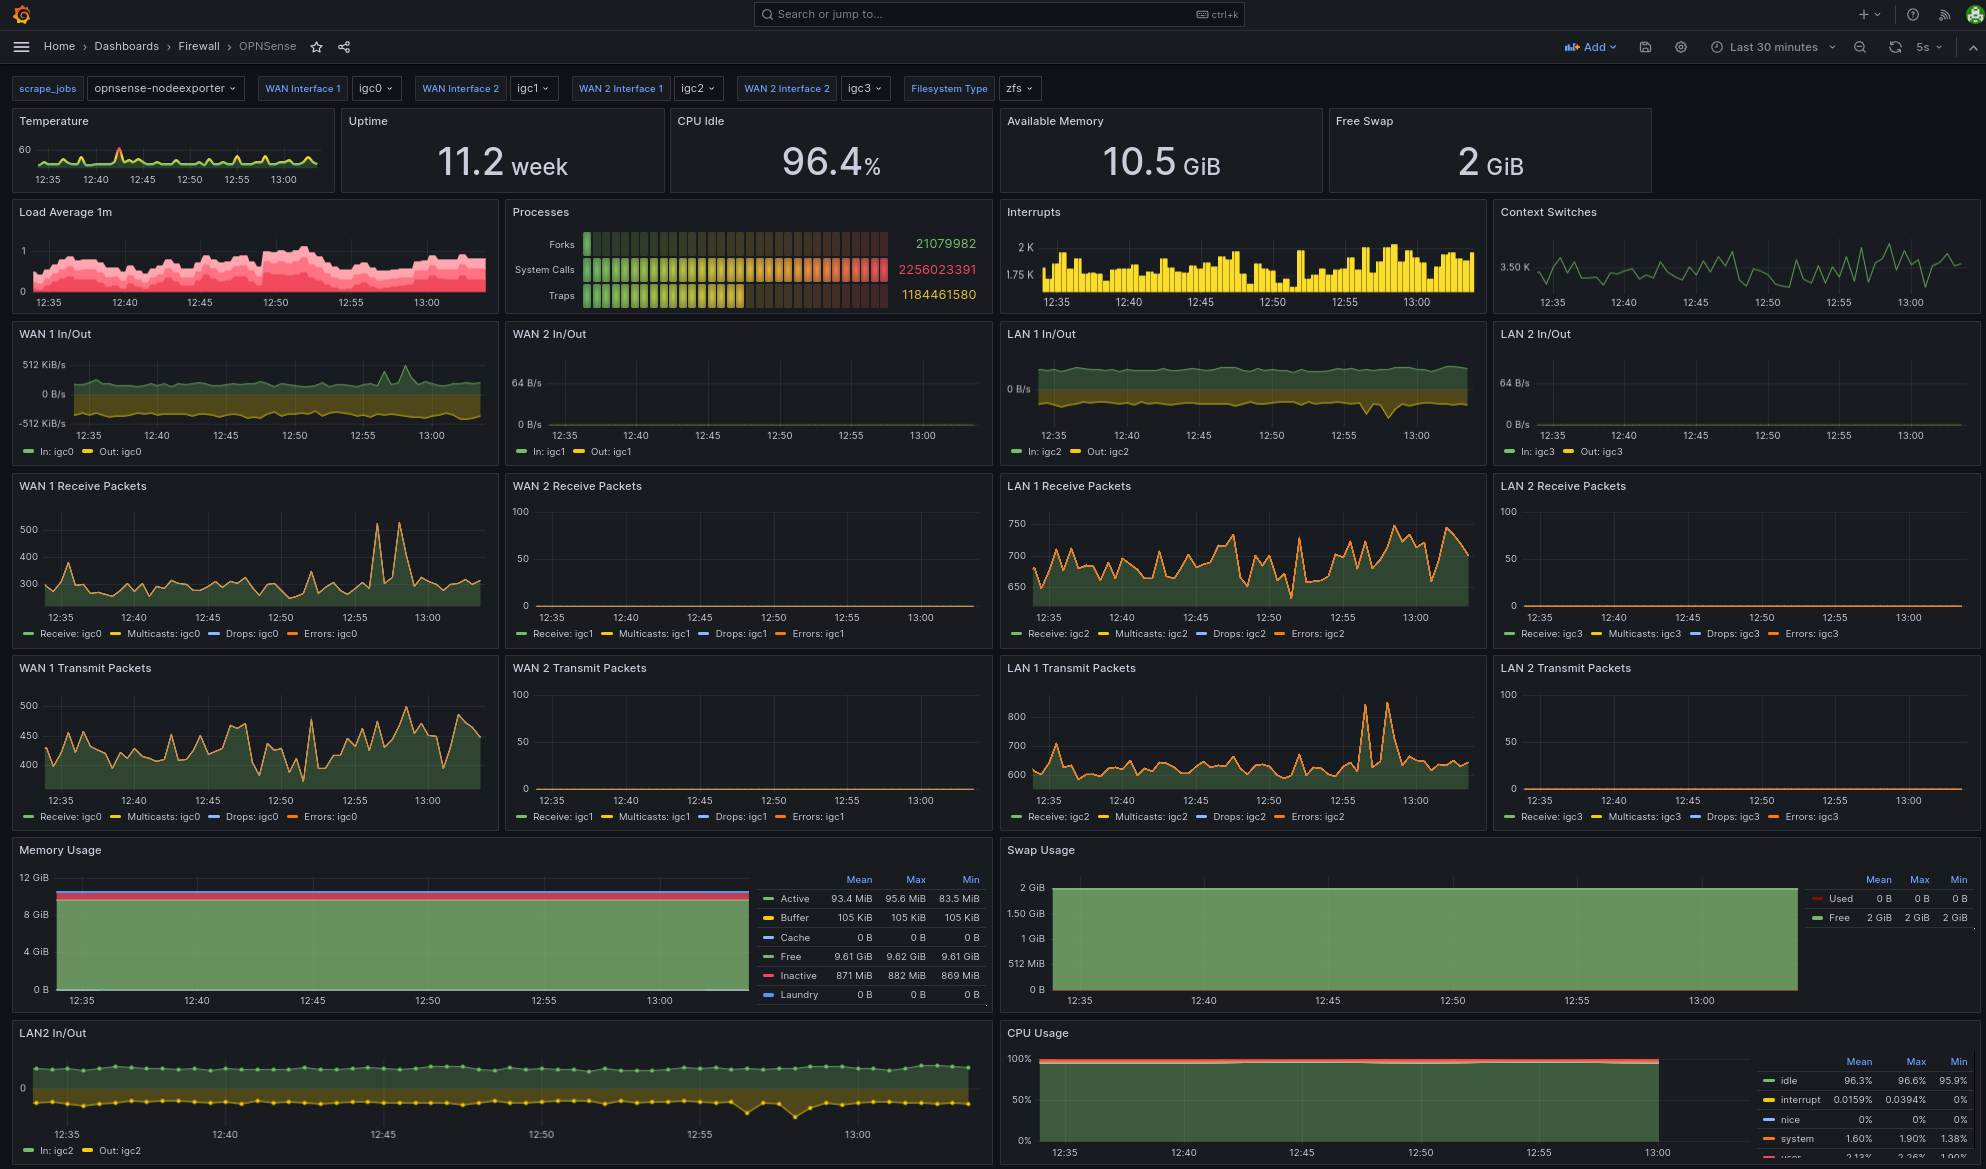
OPNSense
- Install Prometheus Node Exporter Plugin on OPNSense
- Add Scrape Config to Prometheus
      - job_name: opnsense
        static_configs:
        - targets: [<OPNSense IP/fqdn>:9100]
- Add Dashboard to Grafana.
- Configure Variables
- Scrape Job (Same as above)
- Interface match (Wan1, Wan2, Lan1,Lan2)
- Cleanup unused panels(if you only have 2 interfaces etc.)
Data source config
Collector type:
Collector plugins:
Collector config:
Revisions
Upload an updated version of an exported dashboard.json file from Grafana
| Revision | Description | Created | |
|---|---|---|---|
| Download |