
AWS SQS (Prometheus)
AWS SQS Prometheus metrics from CloudWatch exporter
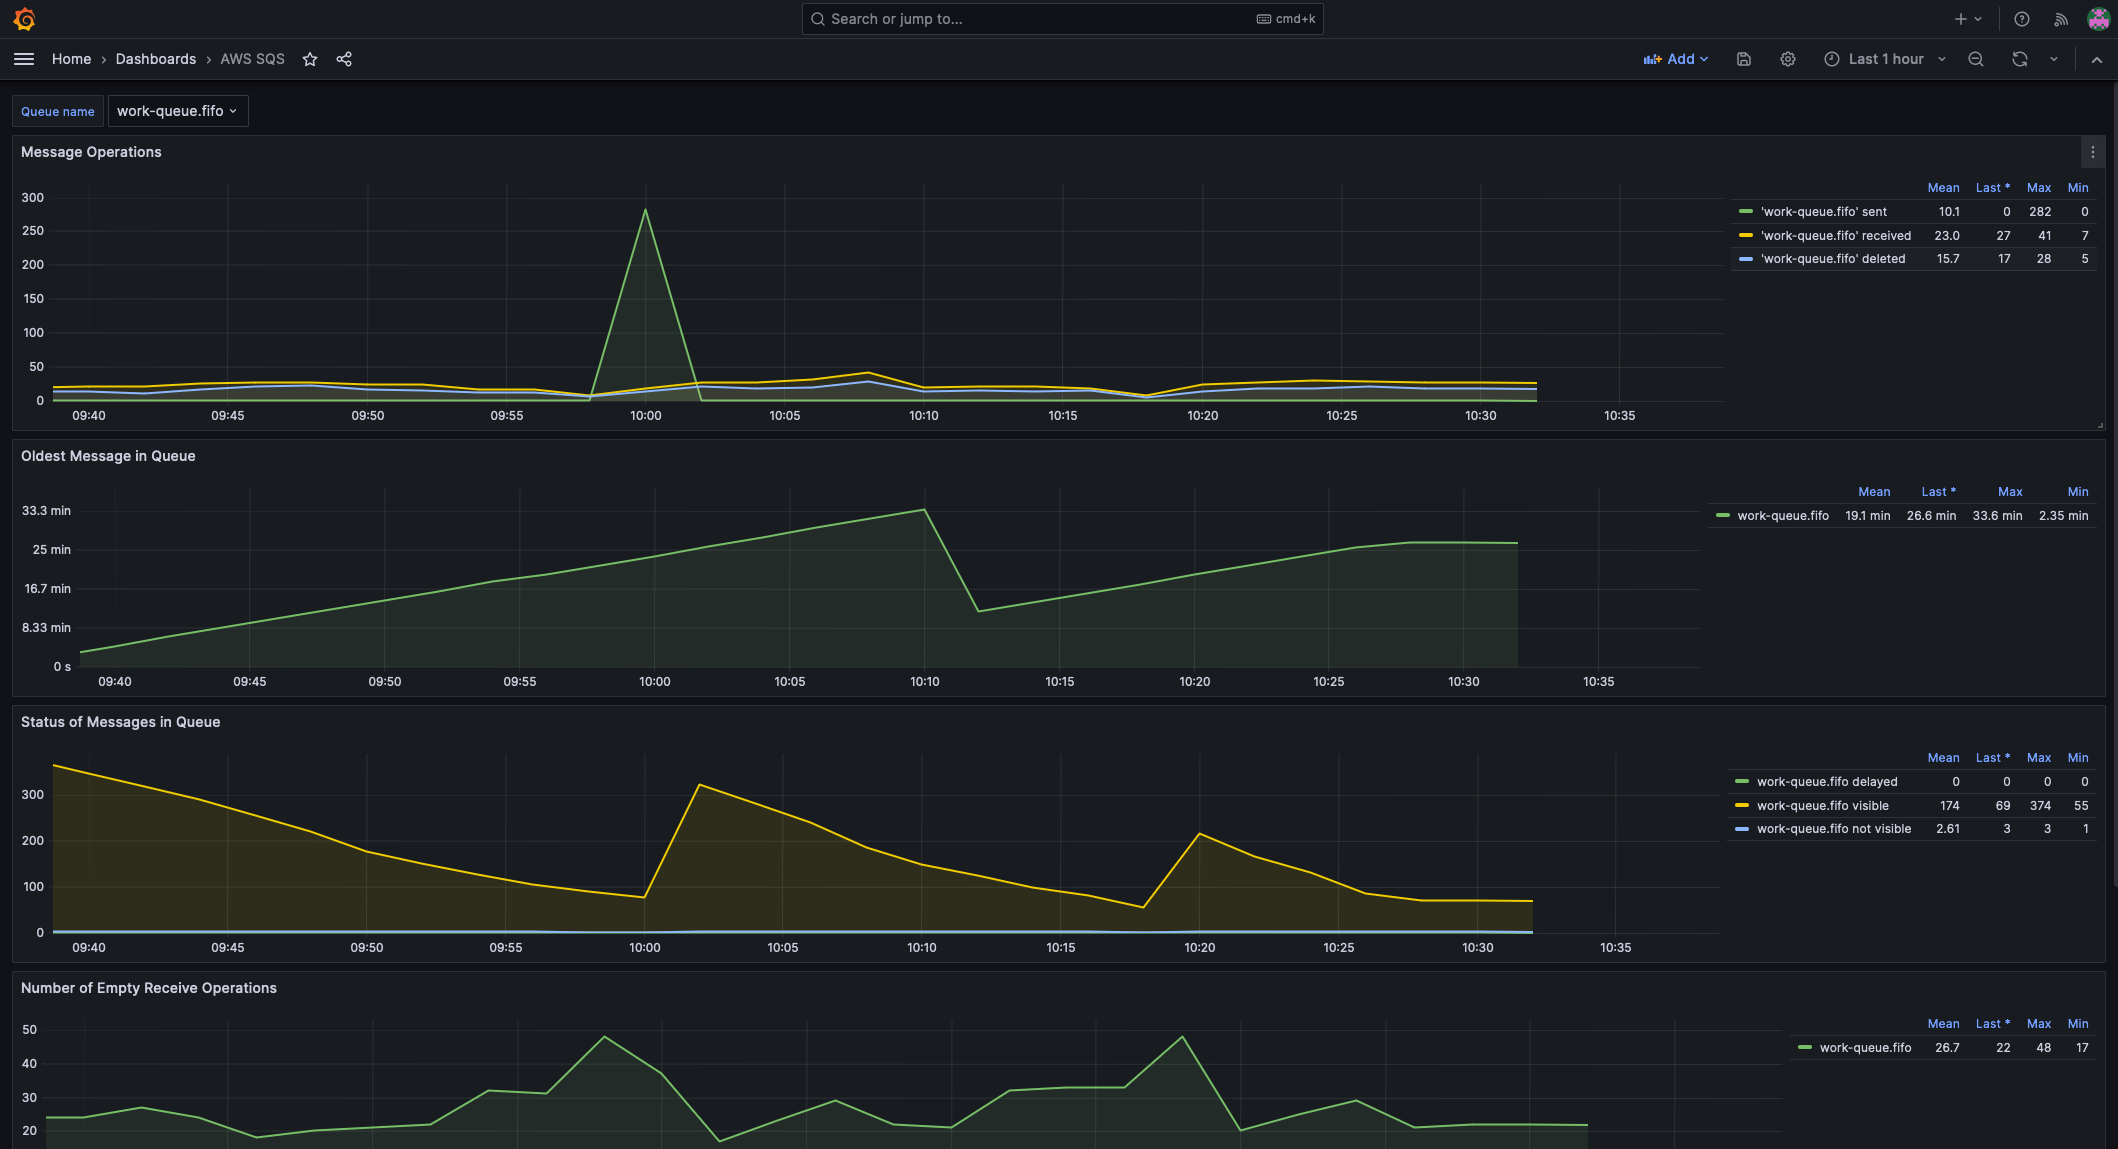
Adapted from dashboard "AWS SQS" (ID 584). This dasboard uses Prometheus instead of CloudWatch as the datasource. The metrics have to be exported with the CloudWatch Exporter.
The CloudWatch exporter settings used are as follows:
# SQS
# https://docs.aws.amazon.com/AWSSimpleQueueService/latest/SQSDeveloperGuide/sqs-available-cloudwatch-metrics.html
#
# CloudWatch metrics for your Amazon SQS queues are automatically collected and pushed to CloudWatch at one-minute intervals.
# These metrics are gathered on all queues that meet the CloudWatch guidelines for being active. CloudWatch considers a queue
# to be active for up to six hours if it contains any messages or if any action accesses it. When an Amazon SQS queue is inactive
# for more than six hours, the Amazon SQS service is considered asleep and stops delivering metrics to the CloudWatch service.
#
# Configuration adapted from: https://sysdig.com/blog/monitor-amazon-sqs-prometheus/
The approximate age of the oldest non-deleted message in the queue.
- aws_namespace: AWS/SQS
aws_metric_name: ApproximateAgeOfOldestMessage
aws_dimensions: [QueueName]
aws_statistics: [Maximum]
The number of messages in the queue that are delayed and not available for reading immediately. This can happen when the queue is configured as a delay queue or when a message has been sent with a delay parameter.
- aws_namespace: AWS/SQS
aws_metric_name: ApproximateNumberOfMessagesDelayed
aws_dimensions: [QueueName]
aws_statistics: [Average]
The number of messages that are in flight. Messages are considered to be in flight if they have been sent to a client but have not yet been deleted or have not yet reached the end of their visibility window.
- aws_namespace: AWS/SQS
aws_metric_name: ApproximateNumberOfMessagesNotVisible
aws_dimensions: [QueueName]
aws_statistics: [Average]
The number of messages available for retrieval from the queue.
- aws_namespace: AWS/SQS
aws_metric_name: ApproximateNumberOfMessagesVisible
aws_dimensions: [QueueName]
aws_statistics: [Average]
The number of ReceiveMessage API calls that did not return a message.
- aws_namespace: AWS/SQS
aws_metric_name: NumberOfEmptyReceives
aws_dimensions: [QueueName]
aws_statistics: [Sum]
The number of messages deleted from the queue.
- aws_namespace: AWS/SQS
aws_metric_name: NumberOfMessagesDeleted
aws_dimensions: [QueueName]
aws_statistics: [Sum]
The number of messages returned by calls to the ReceiveMessage action.
- aws_namespace: AWS/SQS
aws_metric_name: NumberOfMessagesReceived
aws_dimensions: [QueueName]
aws_statistics: [Sum]
The number of messages added to a queue.
- aws_namespace: AWS/SQS
aws_metric_name: NumberOfMessagesSent
aws_dimensions: [QueueName]
aws_statistics: [Sum]
The size of messages added to a queue.
- aws_namespace: AWS/SQS
aws_metric_name: SentMessageSize
aws_dimensions: [QueueName]
aws_statistics: [Sum,Average]
Data source config
Collector type:
Collector plugins:
Collector config:
Revisions
Upload an updated version of an exported dashboard.json file from Grafana
| Revision | Description | Created | |
|---|---|---|---|
| Download |
AWS
Easily visualize and alert on more than 60 Amazon Web Services (AWS) resources using the fully managed Grafana Cloud platform.
Learn more