NGINX Plus Dashboard
Nginx plus native observability, through the dynamic module api output nginx plus real-time status data, including global statistics, ssl status, server / location / upstream status, upstream server active health check results. Enhance the reliability of nginx plus business operation, you can Inherit to any environment, including kubernetes.
Enhancing Business Observability with NGINX Plus
Reference Document: Prometheus-njs | NGINX Documentation
NGINX Plus Running Configuration Example
root@nginx-plus-2:/# nginx -T
nginx: the configuration file /etc/nginx/nginx.conf syntax is ok
nginx: configuration file /etc/nginx/nginx.conf test is successful
# configuration file /etc/nginx/nginx.conf:
user nginx;
worker_processes auto;
error_log /var/log/nginx/error.log notice;
pid /var/run/nginx.pid;
worker_rlimit_nofile 8192;
load_module modules/ngx_http_js_module.so;
load_module modules/ngx_otel_module.so;
events {
worker_connections 4096;
}
http {
include /etc/nginx/mime.types;
default_type application/octet-stream;
js_import /usr/share/nginx-plus-module-prometheus/prometheus.js;
subrequest_output_buffer_size 32k;
log_format main 'cip: $remote_addr, time: [$time_local], request: "$request" '
'upstream_addr: $upstream_addr, response_code: $status, referer: "$http_referer" '
'ua: "$http_user_agent", xff: "$http_x_forwarded_for", upstream_cookie_uid: "$upstream_cookie_uidsession", cookie_uid: "$cookie_uidsession"'
'limit_conn: $limit_conn_status, limit_req: $limit_req_status, request_time: $request_time';
access_log /var/log/nginx/access.log main buffer=16k;
sendfile on;
tcp_nopush on;
keepalive_timeout 128;
resolver 10.1.1.5 valid=10s ipv6=off status_zone=np-resolver;
resolver_timeout 2s;
gzip on;
proxy_buffering on;
proxy_redirect off;
proxy_set_header X-Real-IP $remote_addr;
proxy_set_header X-Forwarded-For $proxy_add_x_forwarded_for;
proxy_set_header Upgrade $http_upgrade;
proxy_set_header Connection "";
proxy_set_header Accept-Encoding "";
proxy_set_header Host "$host";
proxy_http_version 1.1;
proxy_connect_timeout 1;
proxy_read_timeout 3;
proxy_send_timeout 3;
proxy_ignore_client_abort on;
# opentelemetry
otel_exporter {
endpoint telemetry.nginx.local:4317;
}
otel_trace on;
otel_trace_context propagate;
otel_service_name nginx.local:nginx;
include /etc/nginx/conf.d/*.conf;
}
include /etc/nginx/stream_conf.d/*.conf;
configuration file /etc/nginx/mime.types:
types {
text/html html htm shtml;
text/css css;
text/xml xml;
image/gif gif;
image/jpeg jpeg jpg;
application/javascript js;
application/atom+xml atom;
application/rss+xml rss;
text/mathml mml;
text/plain txt;
text/vnd.sun.j2me.app-descriptor jad;
text/vnd.wap.wml wml;
text/x-component htc;
image/avif avif;
image/png png;
image/svg+xml svg svgz;
image/tiff tif tiff;
image/vnd.wap.wbmp wbmp;
image/webp webp;
image/x-icon ico;
image/x-jng jng;
image/x-ms-bmp bmp;
font/woff woff;
font/woff2 woff2;
application/java-archive jar war ear;
application/json json;
application/mac-binhex40 hqx;
application/msword doc;
application/pdf pdf;
application/postscript ps eps ai;
application/rtf rtf;
application/vnd.apple.mpegurl m3u8;
application/vnd.google-earth.kml+xml kml;
application/vnd.google-earth.kmz kmz;
application/vnd.ms-excel xls;
application/vnd.ms-fontobject eot;
application/vnd.ms-powerpoint ppt;
application/vnd.oasis.opendocument.graphics odg;
application/vnd.oasis.opendocument.presentation odp;
application/vnd.oasis.opendocument.spreadsheet ods;
application/vnd.oasis.opendocument.text odt;
application/vnd.openxmlformats-officedocument.presentationml.presentation
pptx;
application/vnd.openxmlformats-officedocument.spreadsheetml.sheet
xlsx;
application/vnd.openxmlformats-officedocument.wordprocessingml.document
docx;
application/vnd.wap.wmlc wmlc;
application/wasm wasm;
application/x-7z-compressed 7z;
application/x-cocoa cco;
application/x-java-archive-diff jardiff;
application/x-java-jnlp-file jnlp;
application/x-makeself run;
application/x-perl pl pm;
application/x-pilot prc pdb;
application/x-rar-compressed rar;
application/x-redhat-package-manager rpm;
application/x-sea sea;
application/x-shockwave-flash swf;
application/x-stuffit sit;
application/x-tcl tcl tk;
application/x-x509-ca-cert der pem crt;
application/x-xpinstall xpi;
application/xhtml+xml xhtml;
application/xspf+xml xspf;
application/zip zip;
application/octet-stream bin exe dll;
application/octet-stream deb;
application/octet-stream dmg;
application/octet-stream iso img;
application/octet-stream msi msp msm;
audio/midi mid midi kar;
audio/mpeg mp3;
audio/ogg ogg;
audio/x-m4a m4a;
audio/x-realaudio ra;
video/3gpp 3gpp 3gp;
video/mp2t ts;
video/mp4 mp4;
video/mpeg mpeg mpg;
video/quicktime mov;
video/webm webm;
video/x-flv flv;
video/x-m4v m4v;
video/x-mng mng;
video/x-ms-asf asx asf;
video/x-ms-wmv wmv;
video/x-msvideo avi;
}
configuration file /etc/nginx/conf.d/app.conf:
server {
listen 80 default_server;
server_name app.nginx.local;
status_zone s-app.nginx.local;
access_log /var/log/nginx/app.nginx.local.access.log main;
error_log /var/log/nginx/app.nginx.local.error.log notice;
proxy_set_header nginx $hostname;
proxy_set_header Host $host;
location / {
status_zone l-app.nginx.local;
proxy_pass http://app;
}
location @health-check {
internal;
proxy_pass http://app;
health_check uri=/ match=200_ok_app fails=1 passes=1 interval=3s;
}
}
upstream app {
keepalive 32;
zone u-app 128k;
server app-1.nginx.local:8001;
server app-2.nginx.local:8002;
server app-3.nginx.local:8003;
server app-4.nginx.local:8004;
}
match 200_ok_app {
status 200-299;
}
configuration file /etc/nginx/conf.d/dvwa.conf:
server {
listen 80;
listen 443 ssl;
server_name dvwa.nginx.local;
status_zone s-dvwa.nginx.local;
ssl_certificate /etc/ssl/nginx/nginx-repo.crt;
ssl_certificate_key /etc/ssl/nginx/nginx-repo.key;
access_log /var/log/nginx/dvwa.nginx.local.access.log main;
error_log /var/log/nginx/dvwa.nginx.local.error.log notice;
proxy_set_header nginx $hostname;
proxy_set_header Host $host;
location / {
status_zone l-dvwa.nginx.local;
proxy_pass http://dvwa;
}
location @health-check {
internal;
proxy_pass http://dvwa;
health_check uri=/login.php match=200_ok_dvwa fails=1 passes=1 interval=3s;
}
}
upstream dvwa {
keepalive 32;
zone u-dvwa 128k;
server dvwa-1.nginx.local:8081;
server dvwa-2.nginx.local:8082;
}
match 200_ok_dvwa {
status 200-299;
}
configuration file /etc/nginx/conf.d/ipaas-erp.conf:
server {
listen 80;
listen 443 ssl;
server_name ipaas-erp.nginx.local;
status_zone s-ipaas-erp.nginx.local;
ssl_certificate /etc/ssl/nginx/nginx-repo.crt;
ssl_certificate_key /etc/ssl/nginx/nginx-repo.key;
access_log /var/log/nginx/ipaas-erp.nginx.local.access.log main;
error_log /var/log/nginx/ipaas-erp.nginx.local.error.log notice;
proxy_set_header nginx $hostname;
proxy_set_header Host $host;
location / {
status_zone l-ipaas-erp.nginx.local;
proxy_pass http://ipaas-erp;
}
location @health-check {
internal;
proxy_pass http://ipaas-erp;
health_check uri=/ match=200_ok_ipaas_erp fails=1 passes=1 interval=3s;
}
}
upstream ipaas-erp {
keepalive 32;
zone u-ipaas-erp 128k;
server ipaas-erp-1.nginx.local:7001;
server ipaas-erp-2.nginx.local:7002;
}
match 200_ok_ipaas_erp {
status 200-299;
}
configuration file /etc/nginx/conf.d/nginx-plus-mgmt.conf:
server {
listen 8080;
access_log off;
status_zone nginx-plus-mgmt-zone;
otel_trace off;
location /api/ {
api write=on;
}
location = /dashboard.html {
root /usr/share/nginx/html;
}
location = /metrics {
js_content prometheus.metrics;
}
}
root@nginx-plus-2:/#
NGINX Plus collects operational status from various modules using zones and exports metric information to Prometheus.
Prometheus Configuration Example
root@telemetry:/home/ubuntu/nginx-demo# cat prometheus.yml
global:
  scrape_interval: 15s
  scrape_timeout: 10s
  evaluation_interval: 1m
  external_labels:
    monitor: codelab-monitor
scrape_configs:
- job_name: nginxplus-target
  honor_timestamps: true
  scrape_interval: 5s
  scrape_timeout: 5s
  metrics_path: /metrics
  scheme: http
  follow_redirects: true
  static_configs:
  - targets:
    - nginx-plus-1.nginx.local:8080
    - nginx-plus-2.nginx.local:8080
root@telemetry:/home/ubuntu/nginx-demo#
To import this dashboard into Grafana, follow these steps:
- Open Grafana and go to the dashboard page.
- Click on "Import" to import a new dashboard.
- Paste the dashboard JSON code or upload the JSON file containing the dashboard configuration.
- After importing, go to "Dashboard Settings."
- Under "Variables," navigate to "Query Options."
- Modify the "Regex" field to match your environment's Prometheus job/task. Use "nginxplus.*" in this case to include all related metrics.
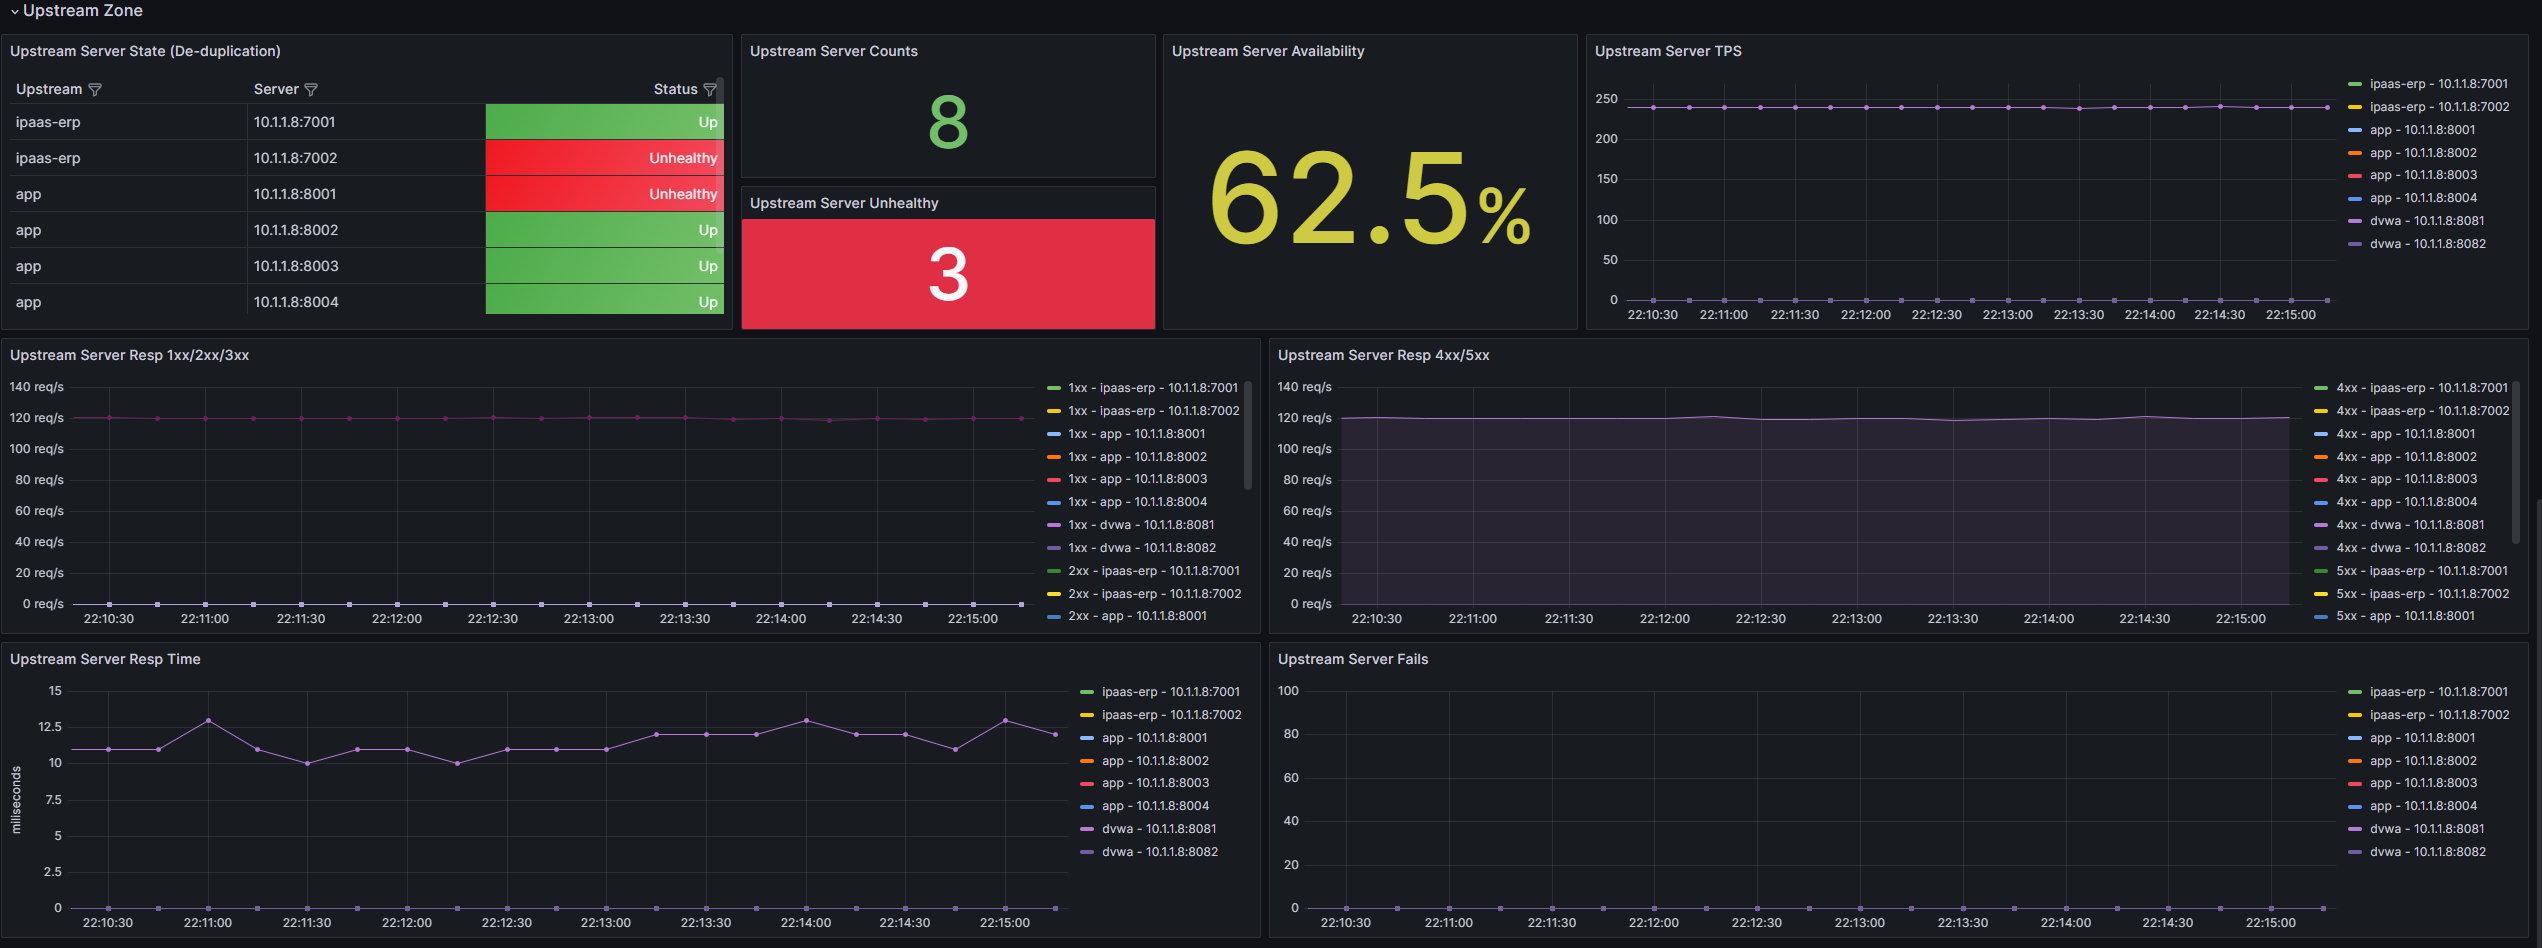
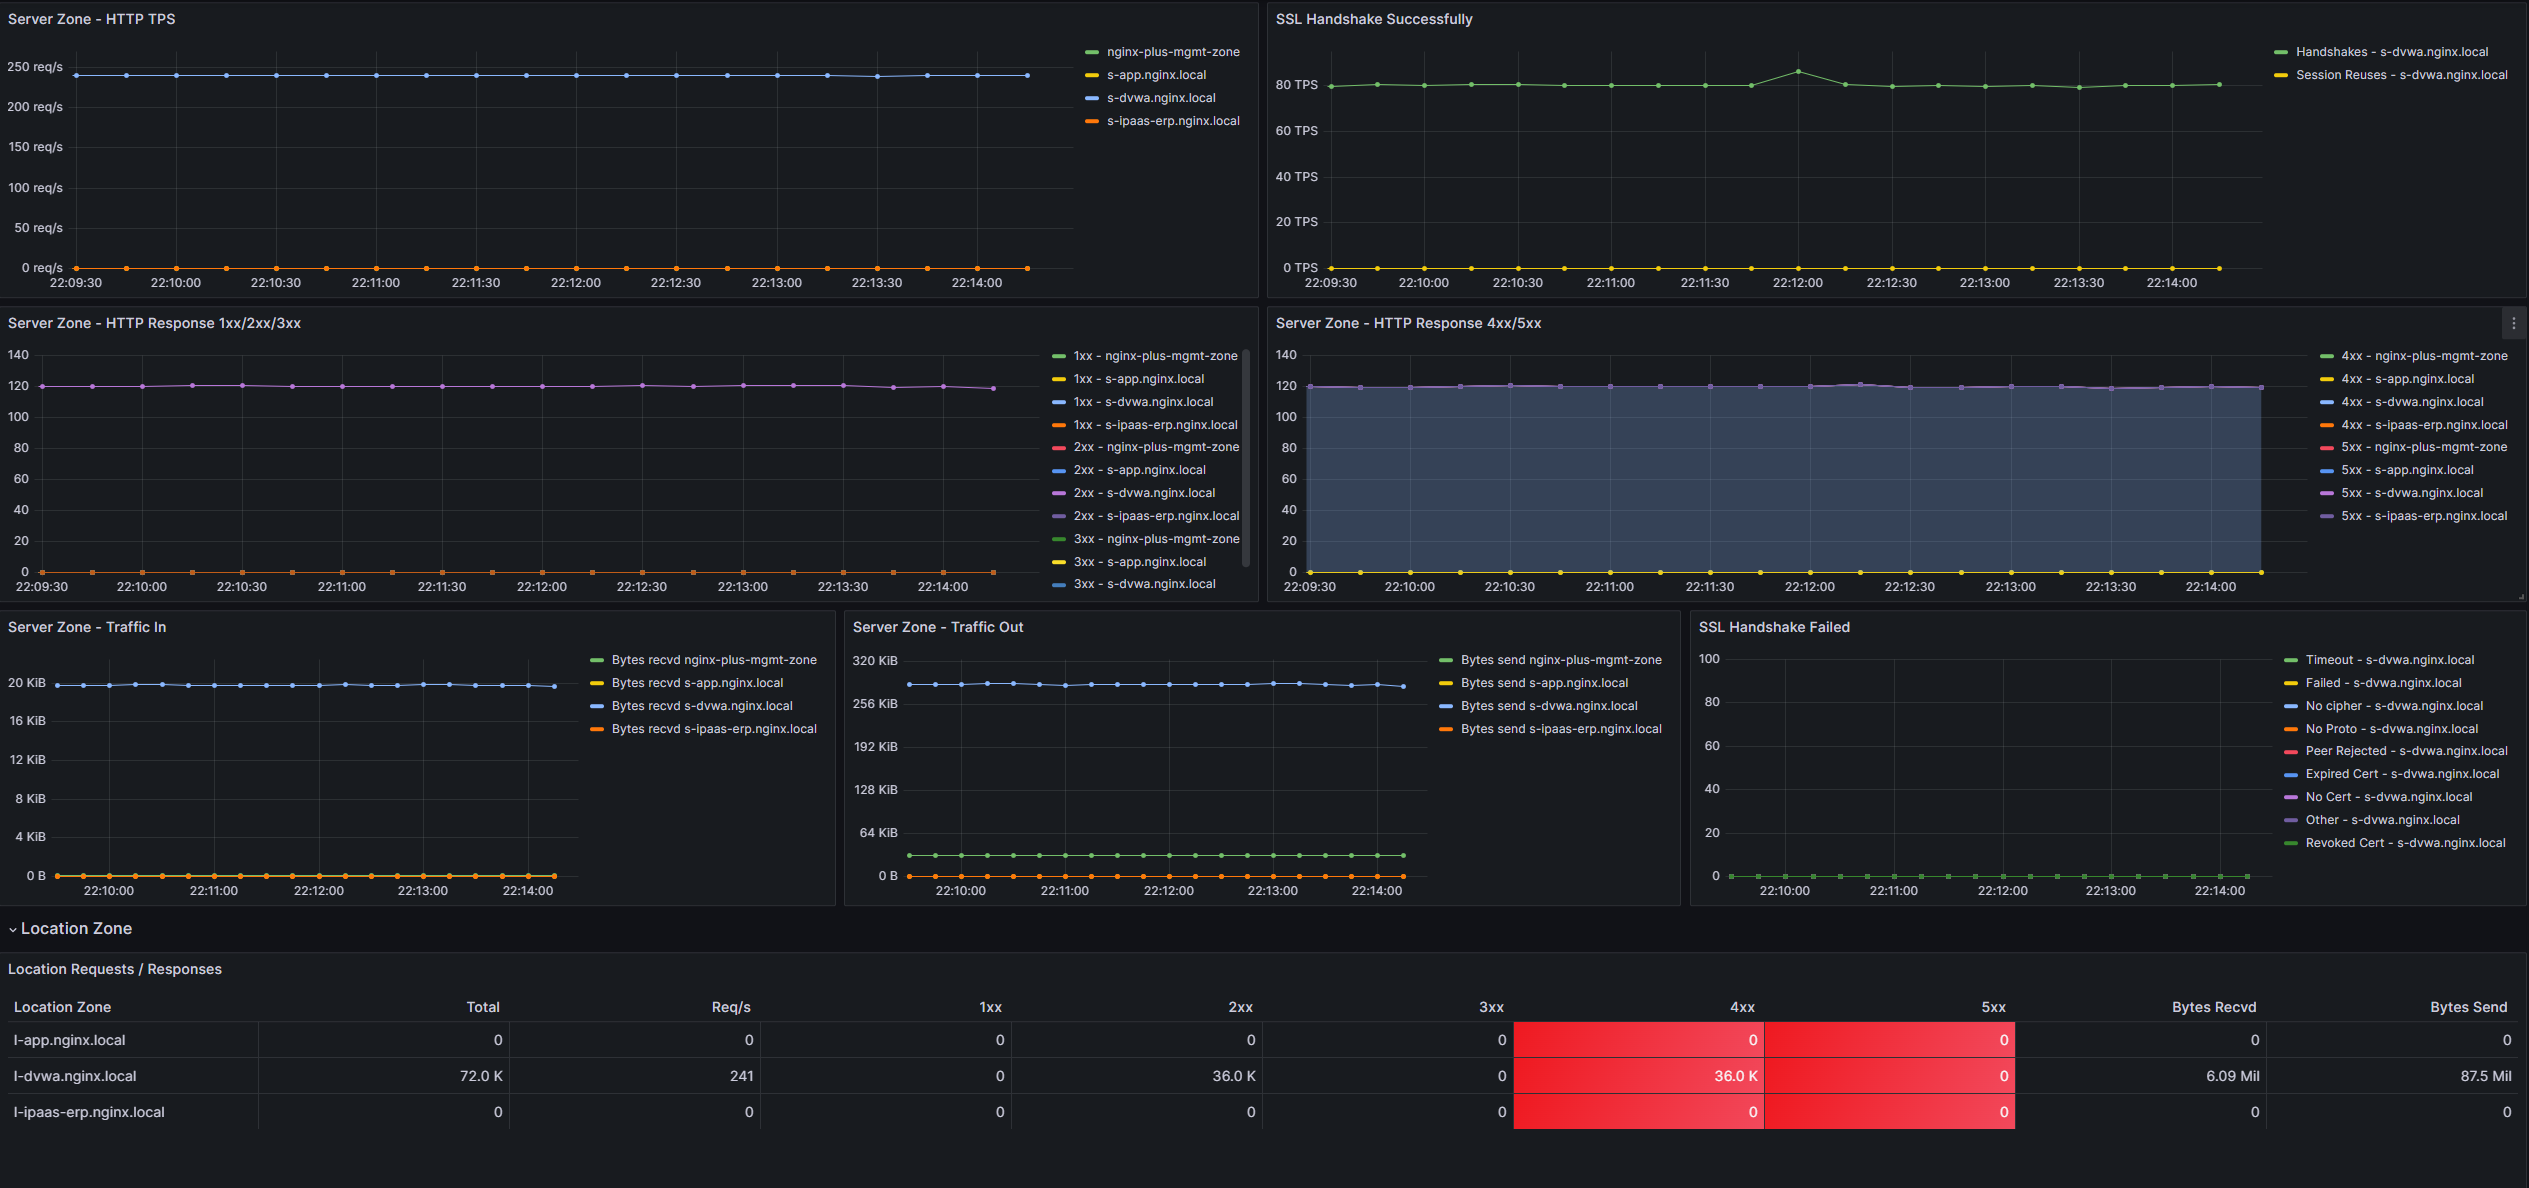
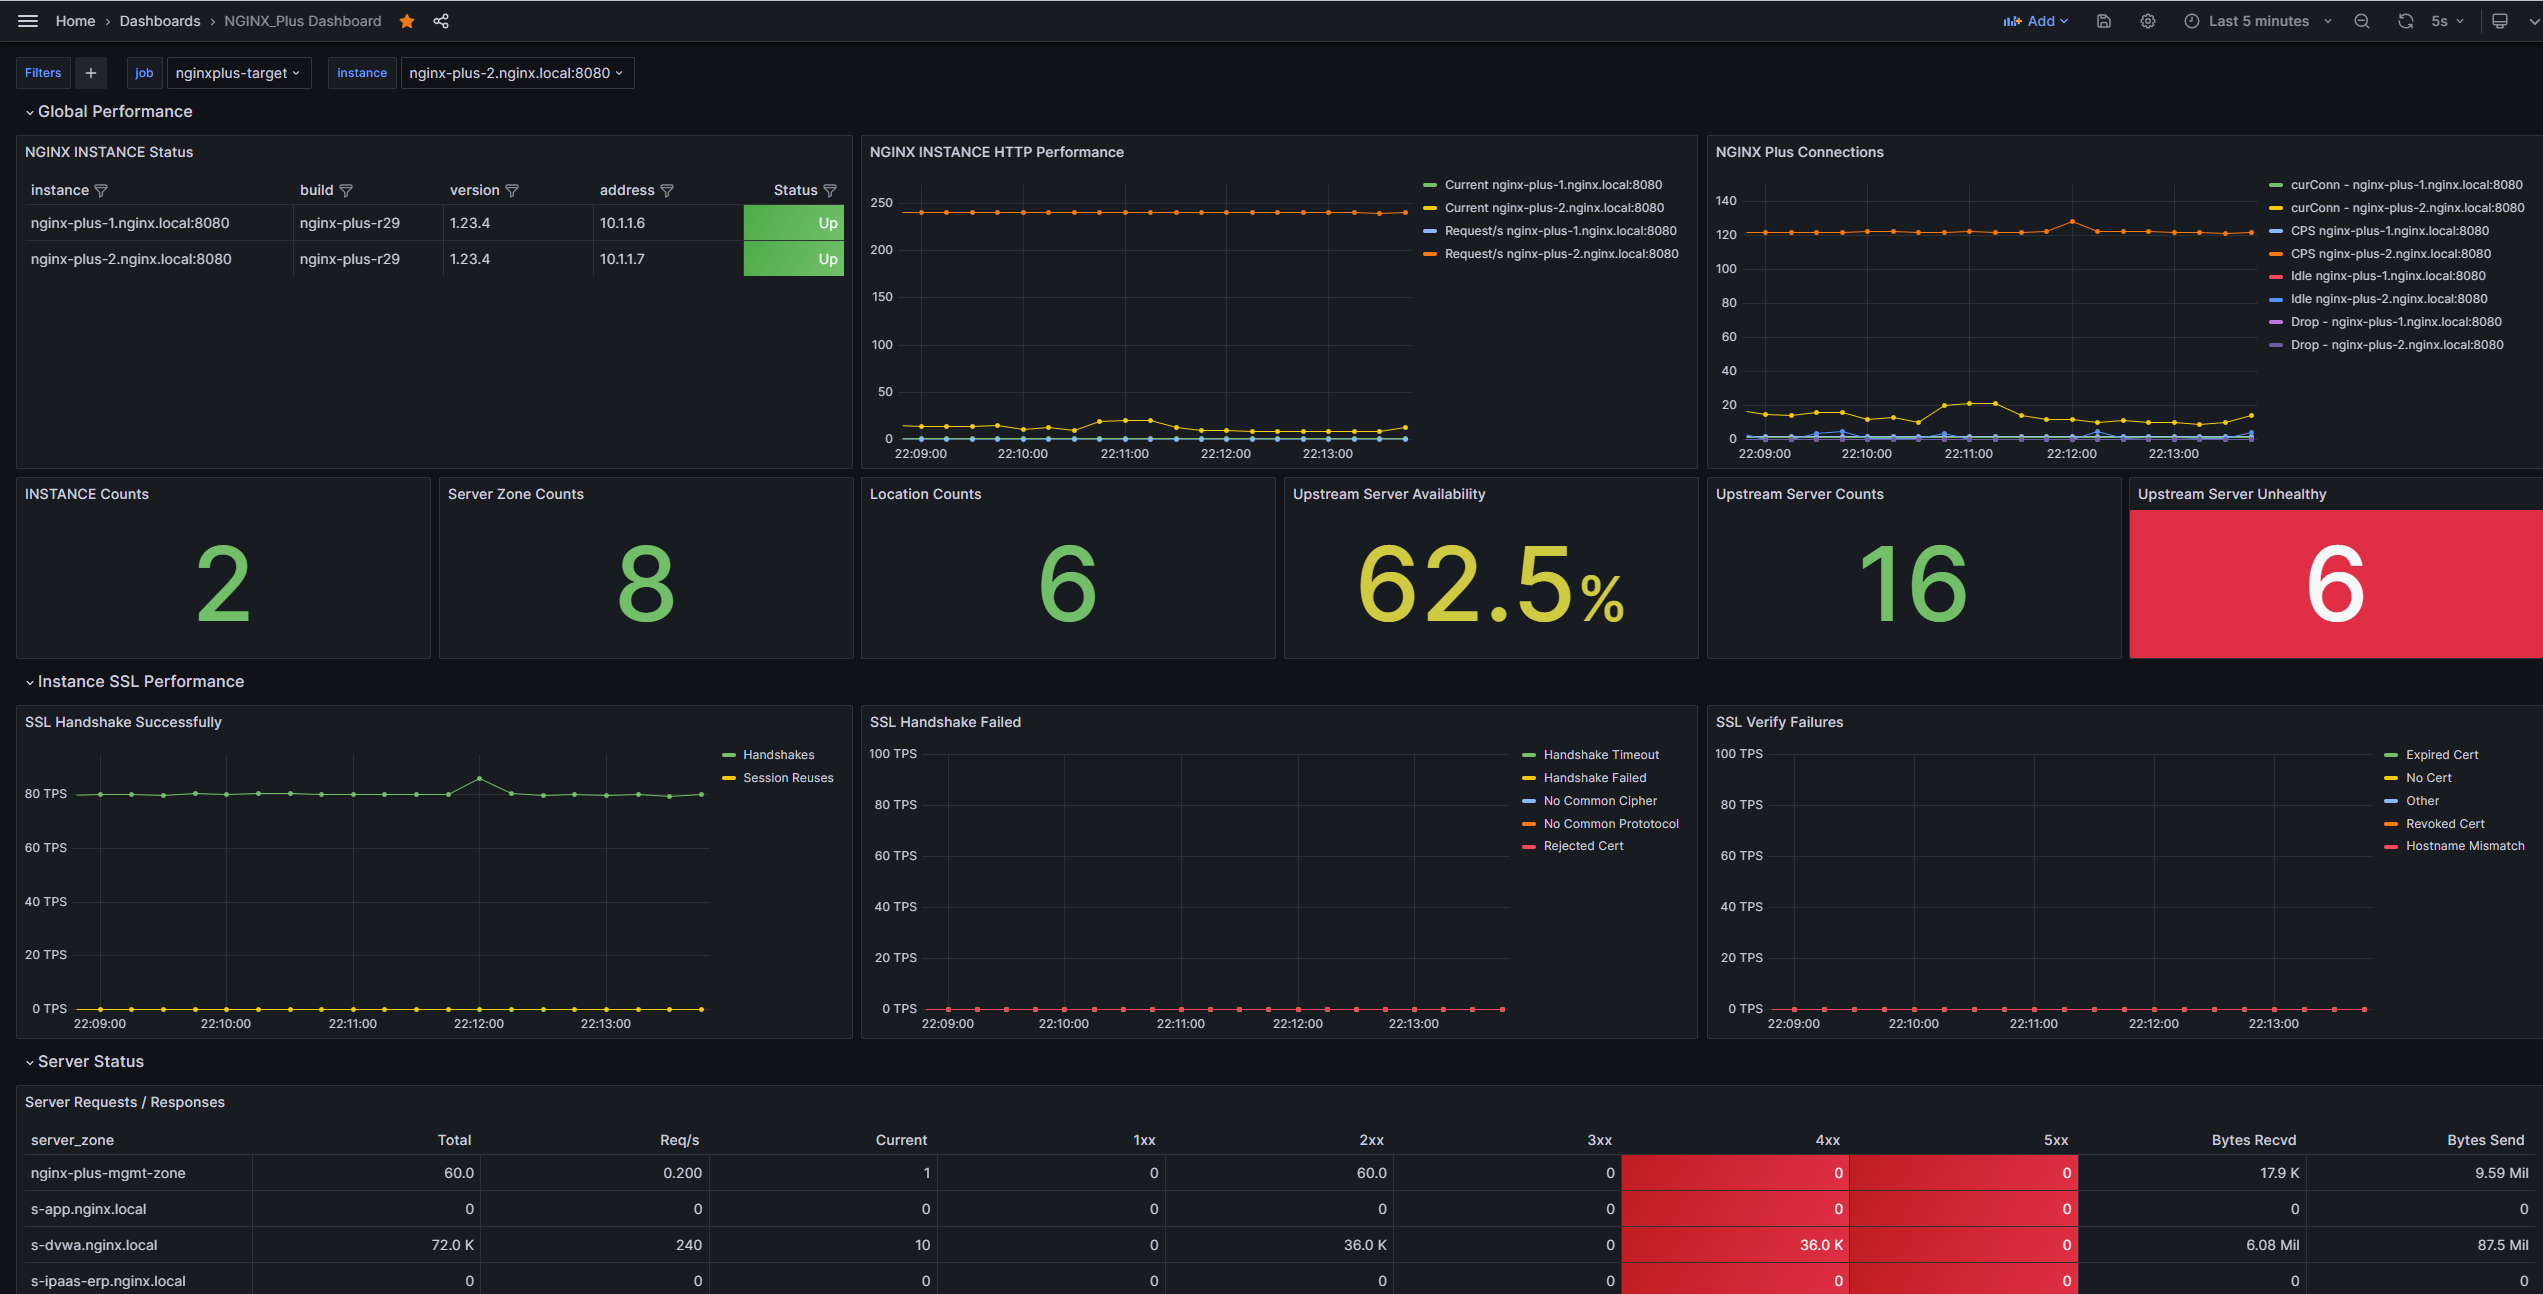
- The dashboard is divided into five sections: Global Performance, Instance SSL Performance, Server Status, Location Zone, and Upstream Zone. The "Global Performance" section contains statistics for all NGINX Plus instances, while the other sections are associated with specific NGINX Plus instance information.
Make sure your Prometheus server is correctly configured to scrape NGINX Plus metrics, and the dashboard should now display the relevant information based on your environment.
If you have any questions, feel free to contact me at any time.
Data source config
Collector config:
Upload an updated version of an exported dashboard.json file from Grafana
| Revision | Description | Created | |
|---|---|---|---|
| Download |
NGINX
Easily monitor NGINX, an open source software for web serving, reverse proxying, caching, load balancing, media streaming, and more, with Grafana Cloud's out-of-the-box monitoring solution.
Learn more