
z/VM Multi-System Overview
The dashboard is intended to provide an overview of multiple z/VM® systems in a single dashboard.
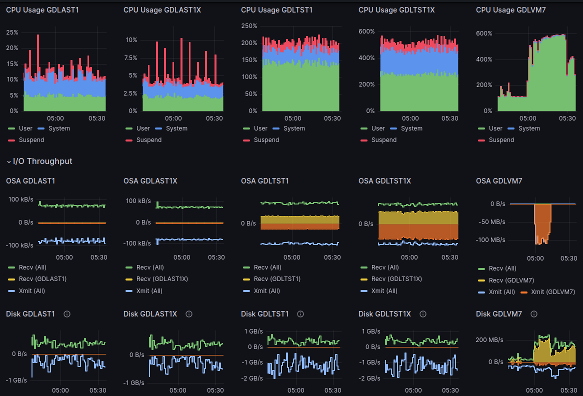
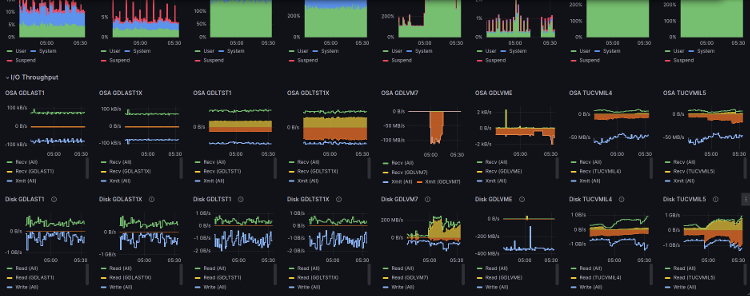
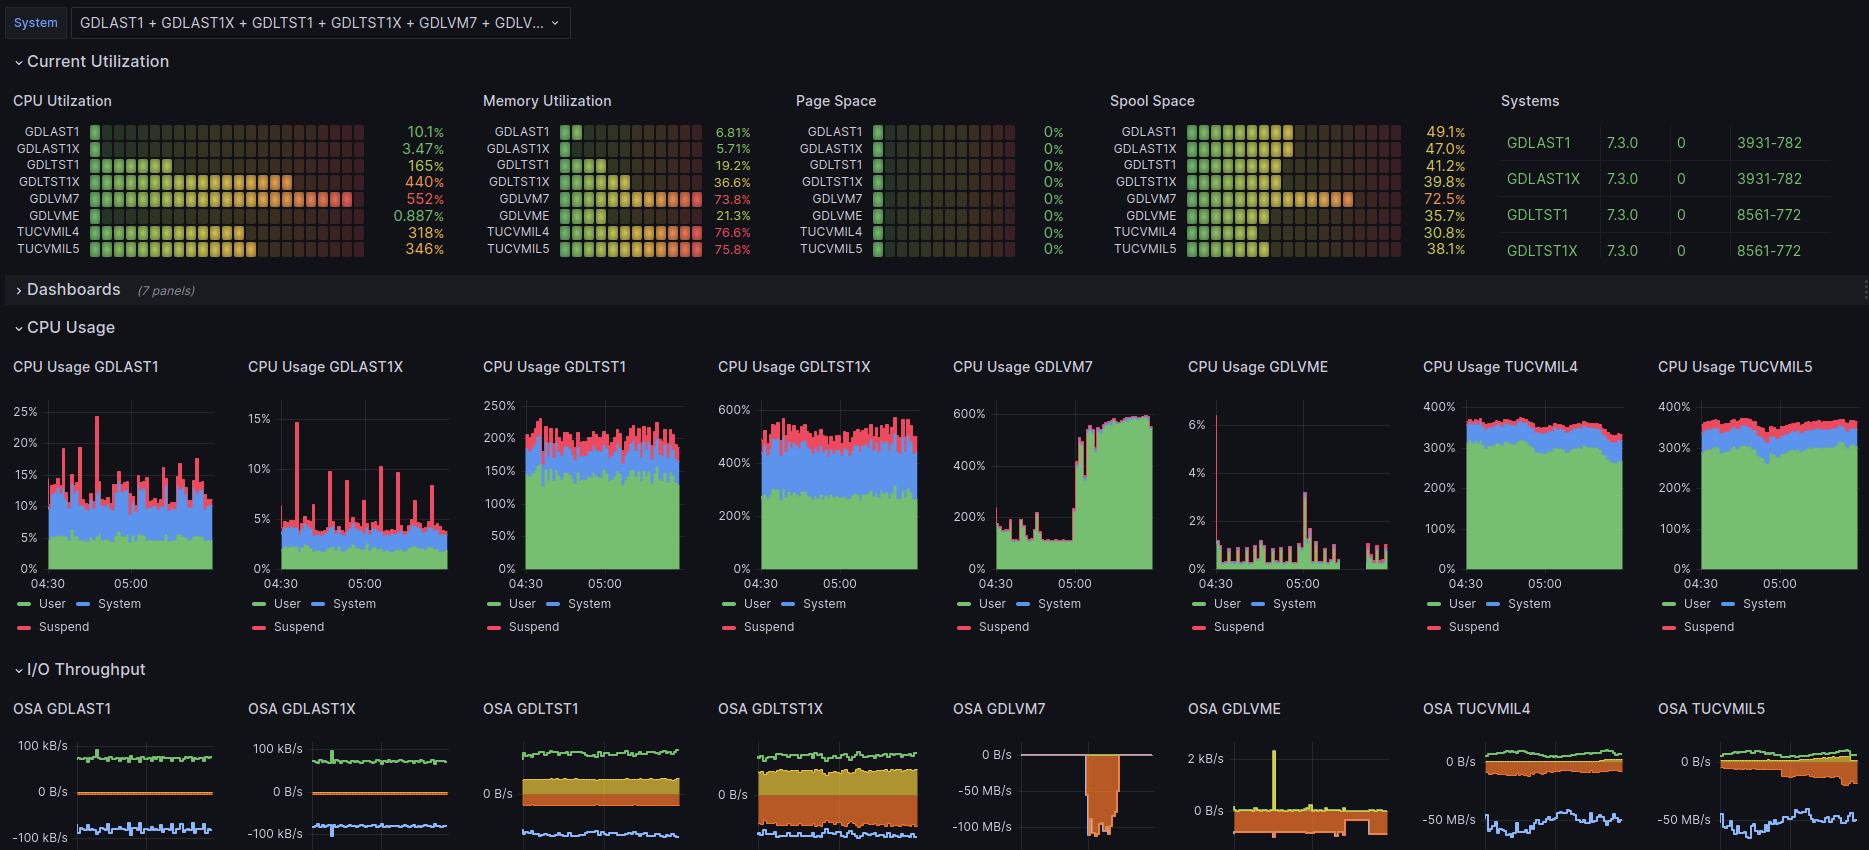
The dashboard is intended to provide an overview of multiple z/VM® systems in a single dashboard, not necessarily restricted to the same Single System Image (SSI). For each of the selected z/VM systems, the dashbooard shows CPU, memory, network and disk I/O metrics.
Installations running multiple z/VM systems may find this dashboard a convenient home screen to start investigation of system performance.
For those who prefer a diverging (positive/negative) axis view, you can invert one metric—such as transmit traffic—by adding a negative sign in the query (for example, multiply the value by -1). This allows receive and transmit values to appear on opposite sides of the axis, recreating the traditional split-visualization style.
This dashboard is licensed by IBM under the Apache 2.0 License and is provided ‘as is’ without warranty, representation, support, maintenance or an obligation to issue updates.
Data source config
Collector config:
Upload an updated version of an exported dashboard.json file from Grafana
| Revision | Description | Created | |
|---|---|---|---|
| Download |