dotnet-monitor dashboard
This dotnet-monitor dashboard is designed to show the default .NET metrics scraped using Managed Prometheus on Azure.
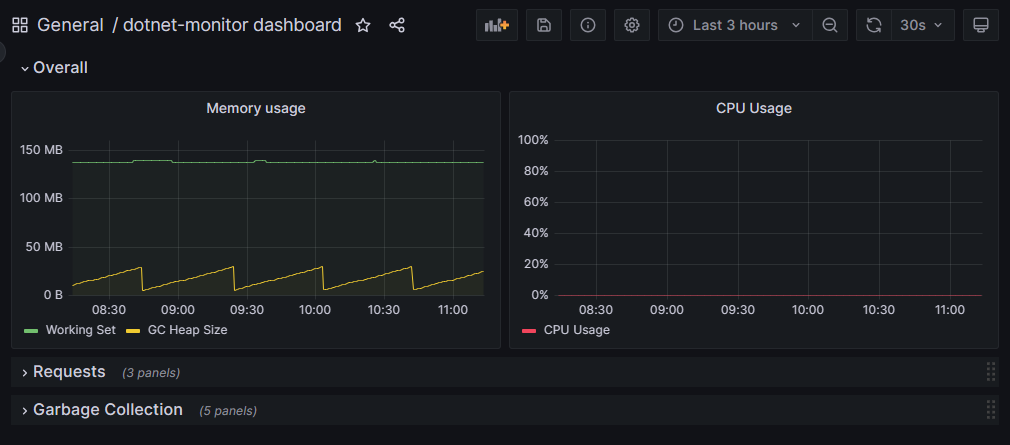
With the Prometheus data source configured to scrape data from dotnet-monitor, this dashboard helps you visualize the health of .NET applications running in your pod.
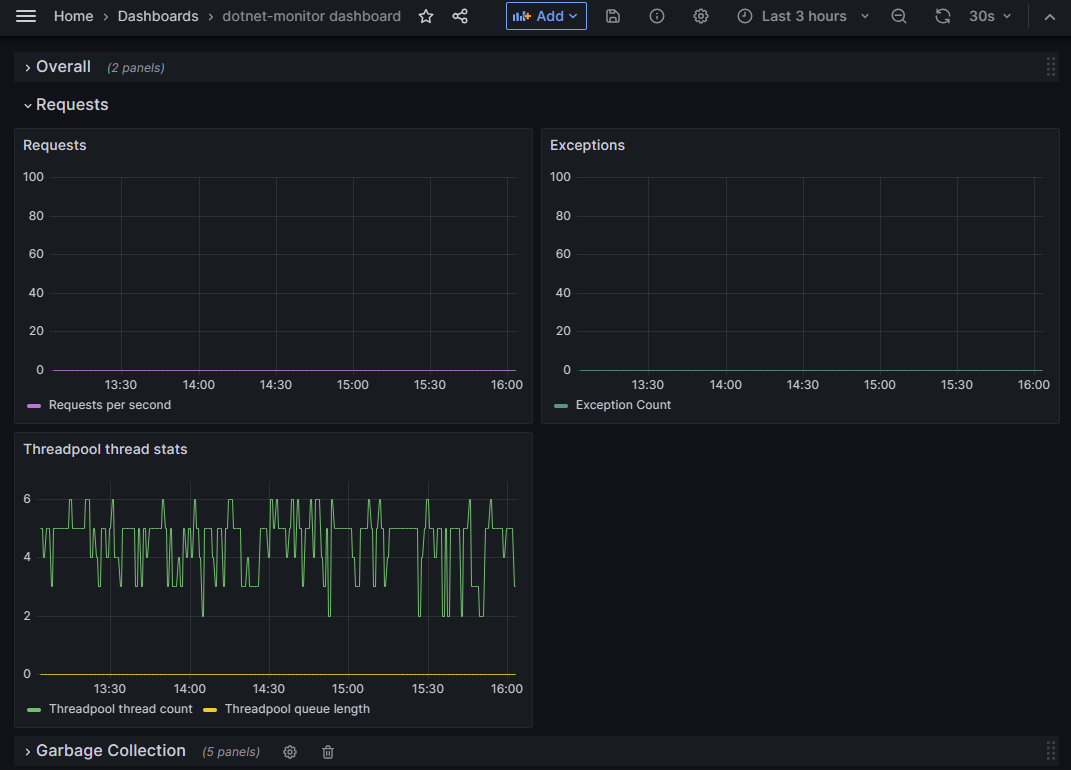
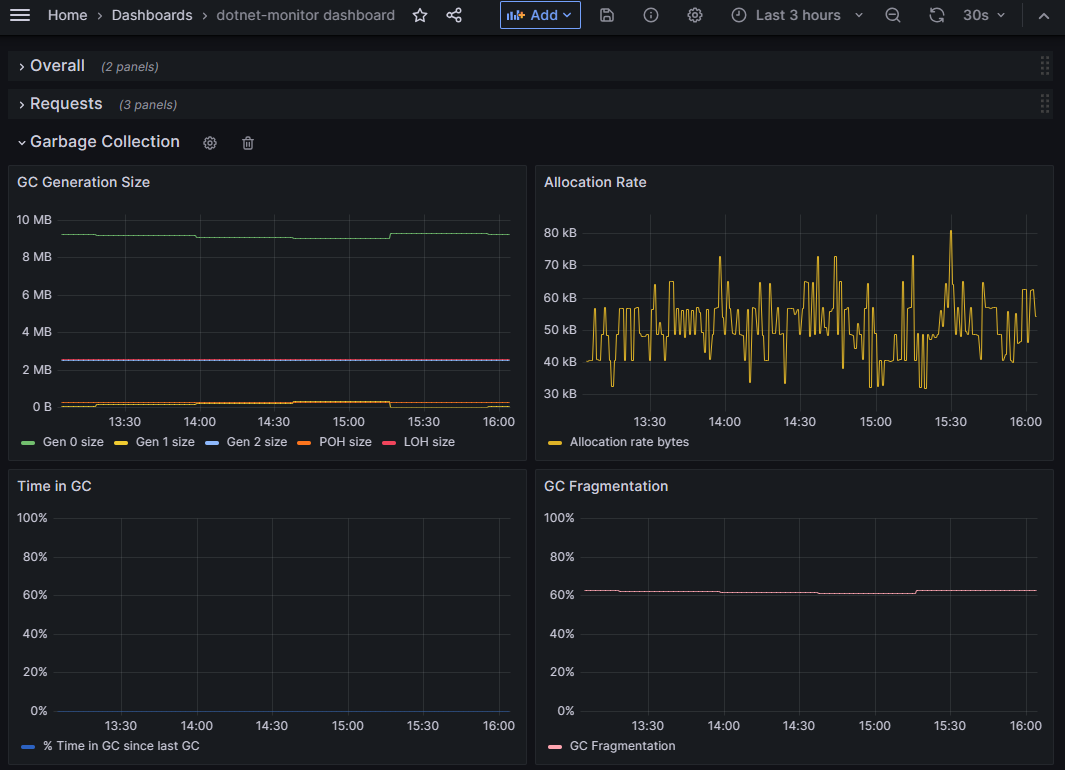
The dashboard shows the key default metrics relating to Memory, CPU, Requests and Garbage collection.
More information:
- Set pod level annotations for Prometheus scraping
- Customize scraping of Prometheus metrics in Azure Monitor managed service for Prometheus
Send your feedback to the dotnet-monitor team on GitHub.
Data source config
Collector type:
Collector plugins:
Collector config:
Revisions
Upload an updated version of an exported dashboard.json file from Grafana
| Revision | Description | Created | |
|---|---|---|---|
| Download |