Armeria Endpoint Statistics
A dashboard to overview Endpoints by service and method in Armeria Framework using Prometheus.
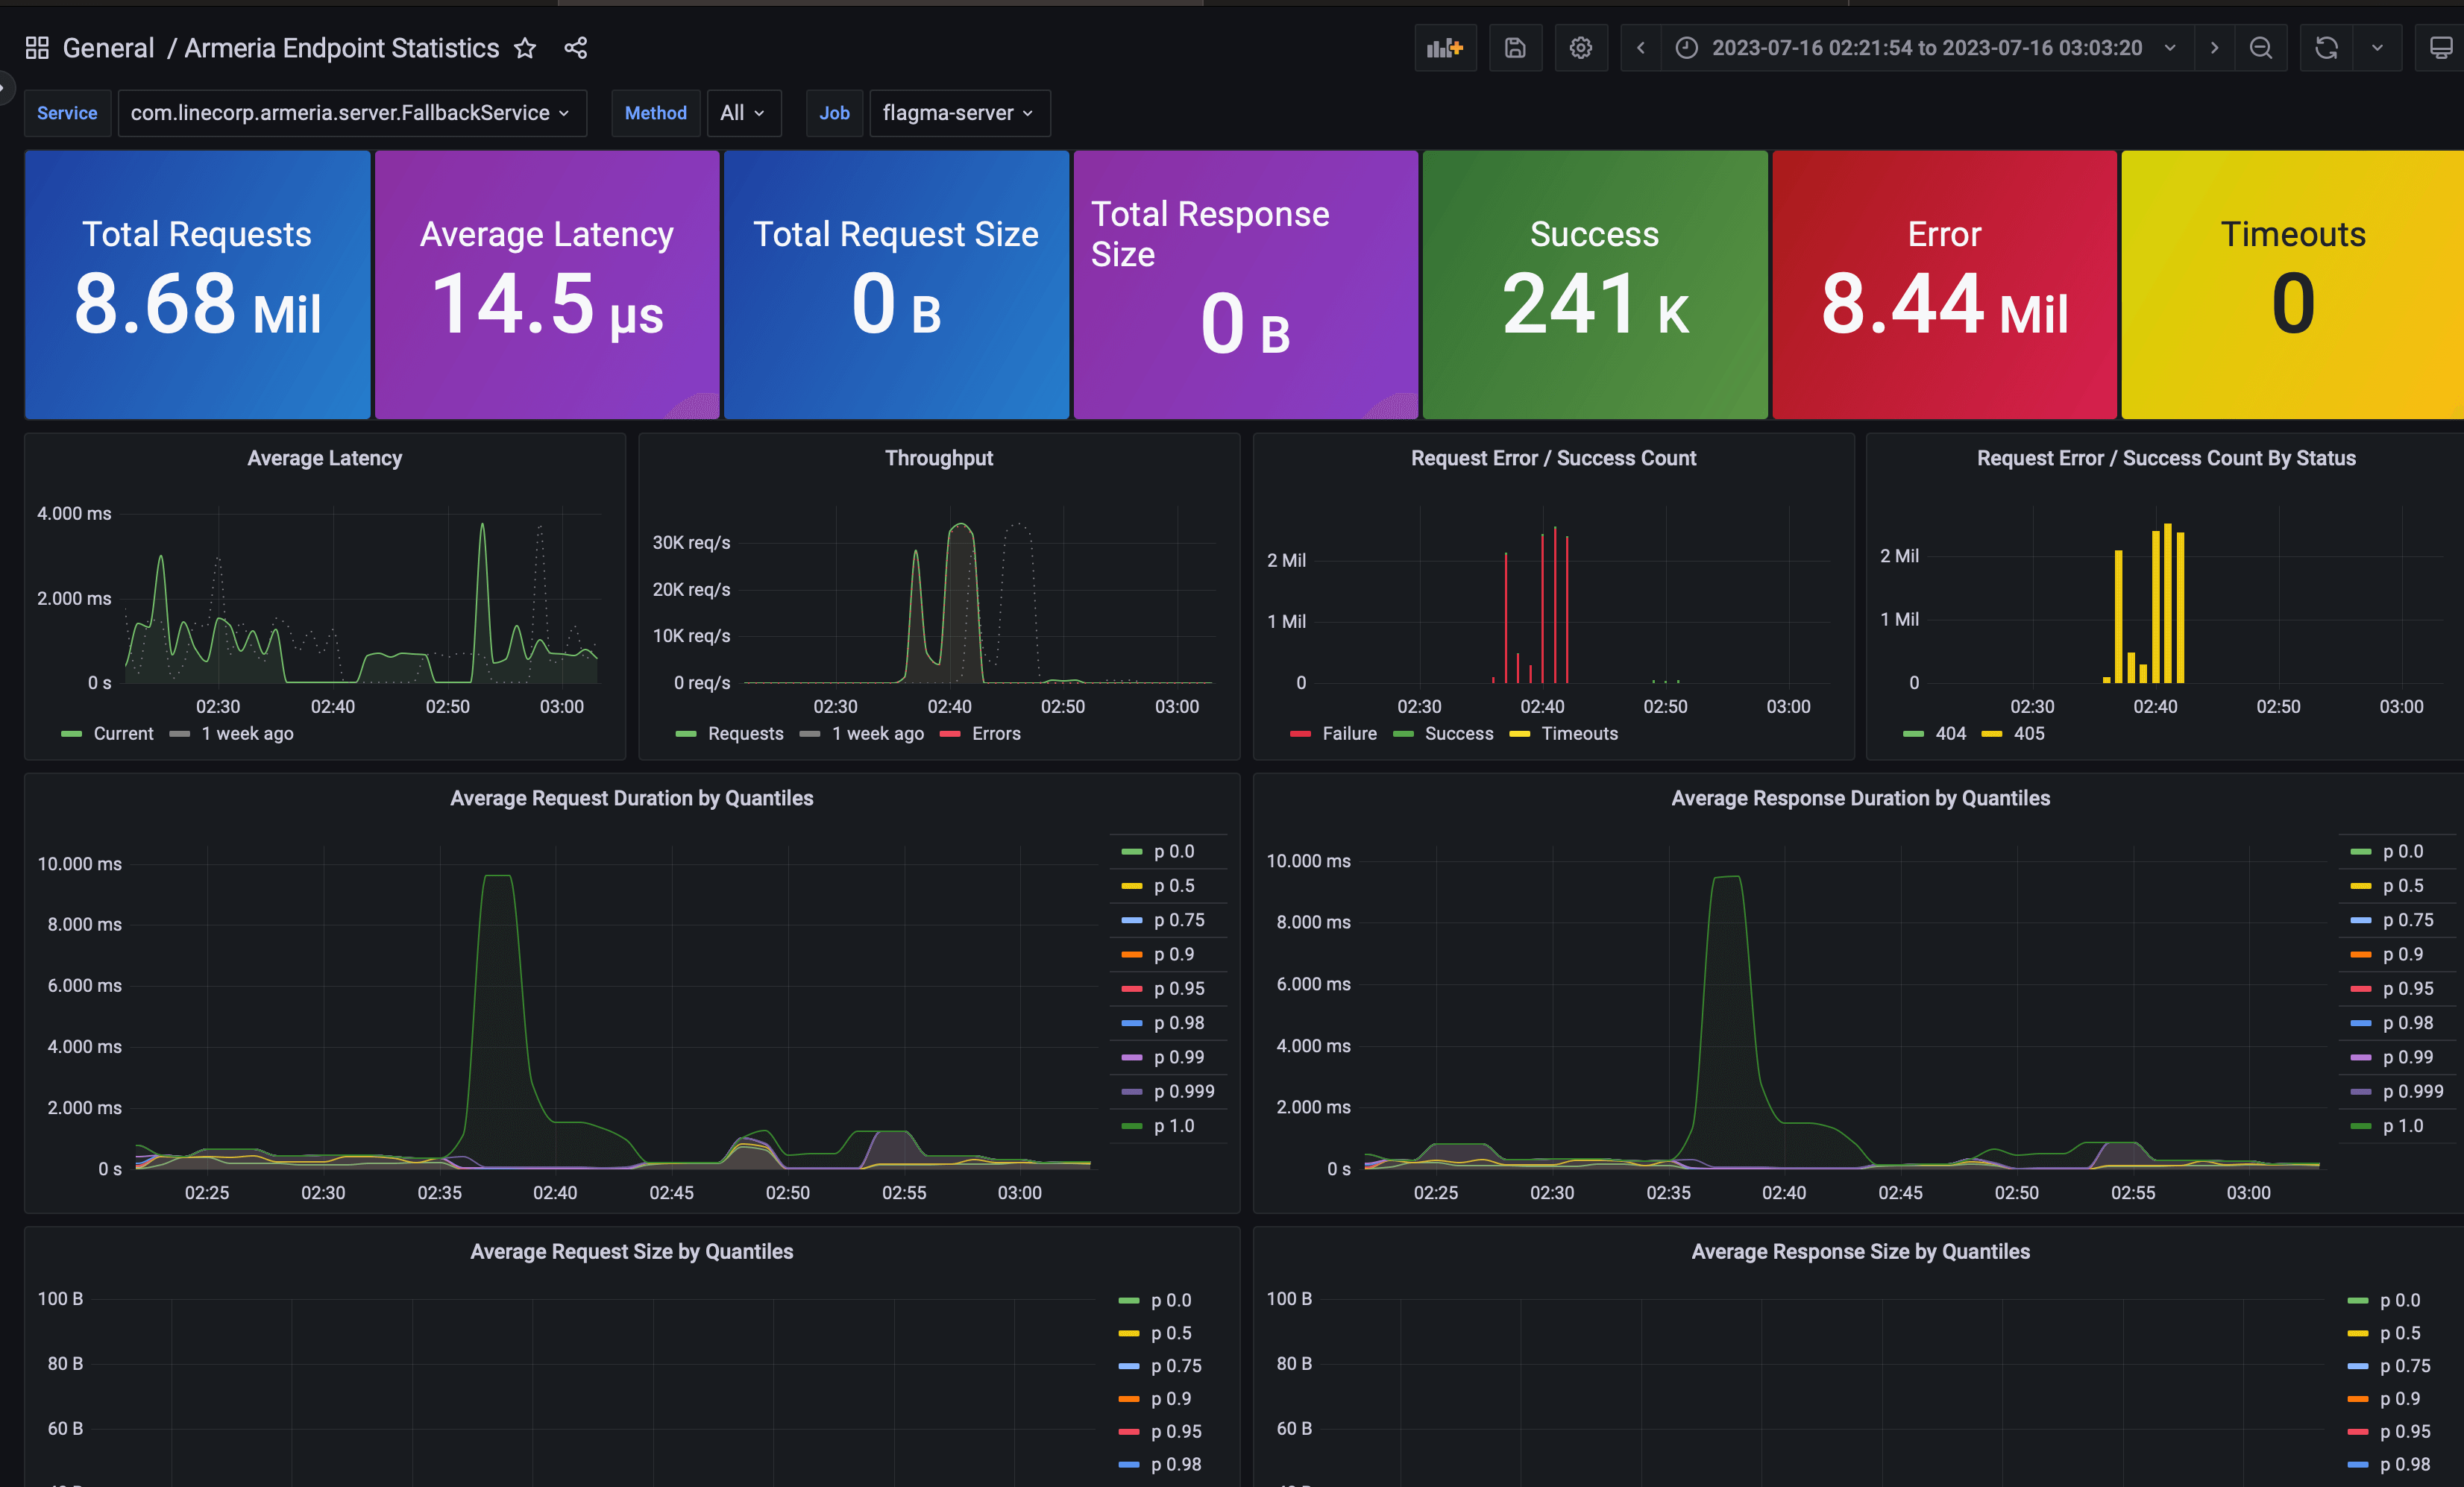
This dashboard uses the default metrics exported by Armeria as described in Collecting Metrics.
By default, MeterIdPrefixFunction.ofDefault("armeria.http.service") prefix function is assumed to be used.
For any feedback or issues, please visit Armeria GitHub Page.
Data source config
Collector type:
Collector plugins:
Collector config:
Revisions
Upload an updated version of an exported dashboard.json file from Grafana
| Revision | Description | Created | |
|---|---|---|---|
| Download |
Metrics Endpoint (Prometheus)
Easily monitor any Prometheus-compatible and publicly accessible metrics URL with Grafana Cloud's out-of-the-box monitoring solution.
Learn more