Proxmox Dashboards
Proxmox Dashboard complete, using Flux + Loki
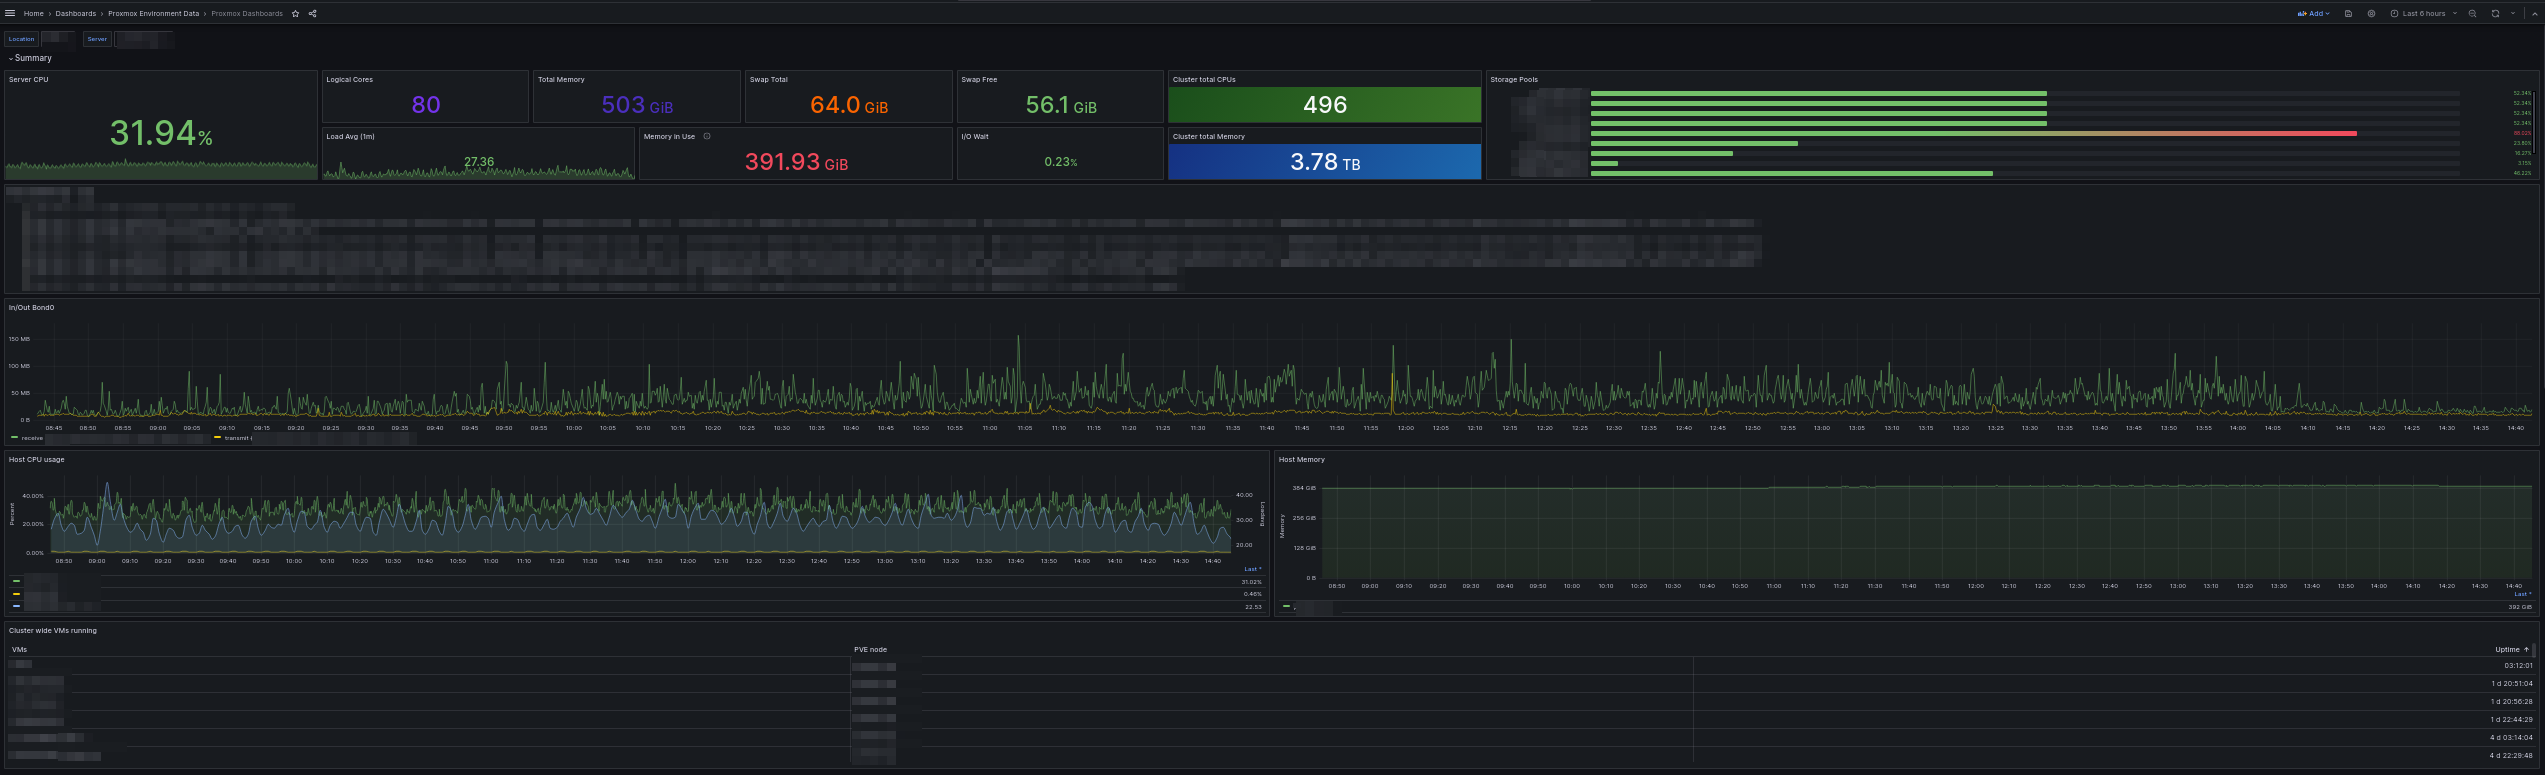
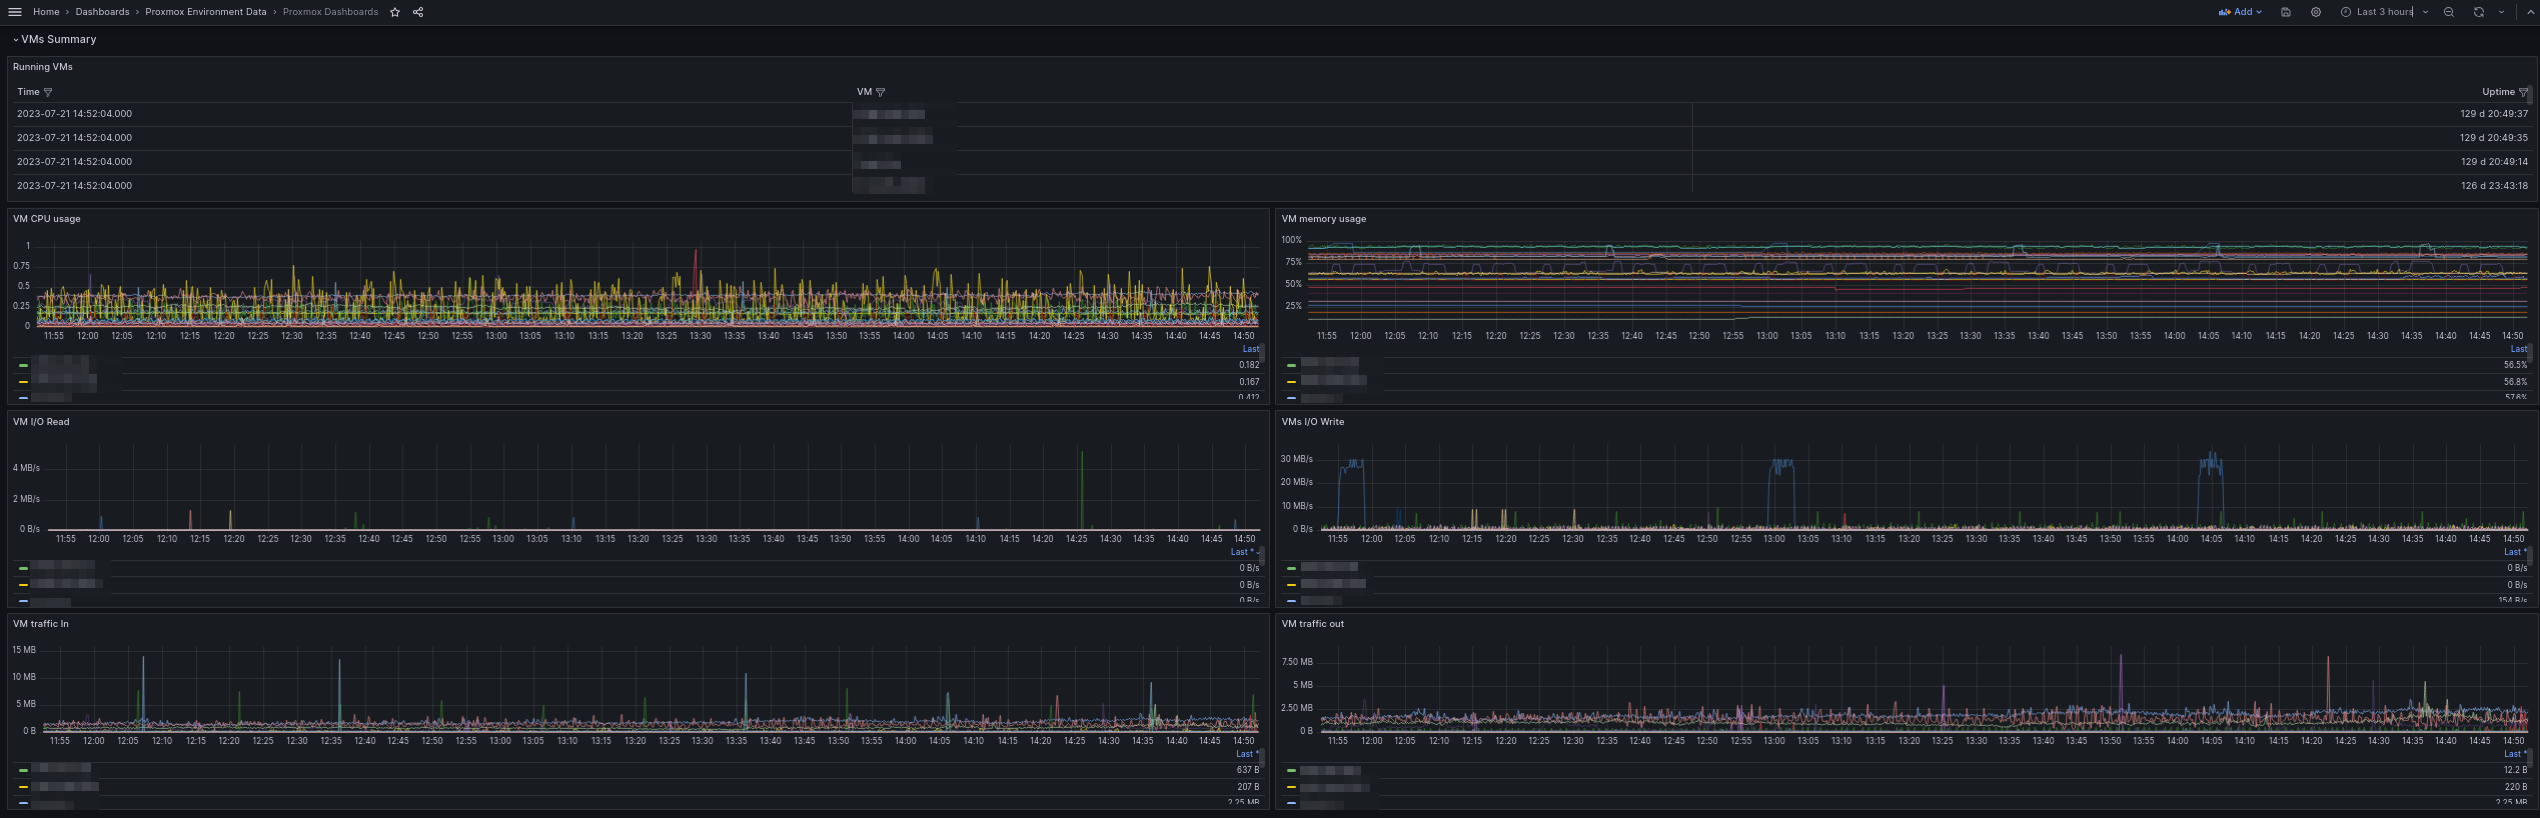
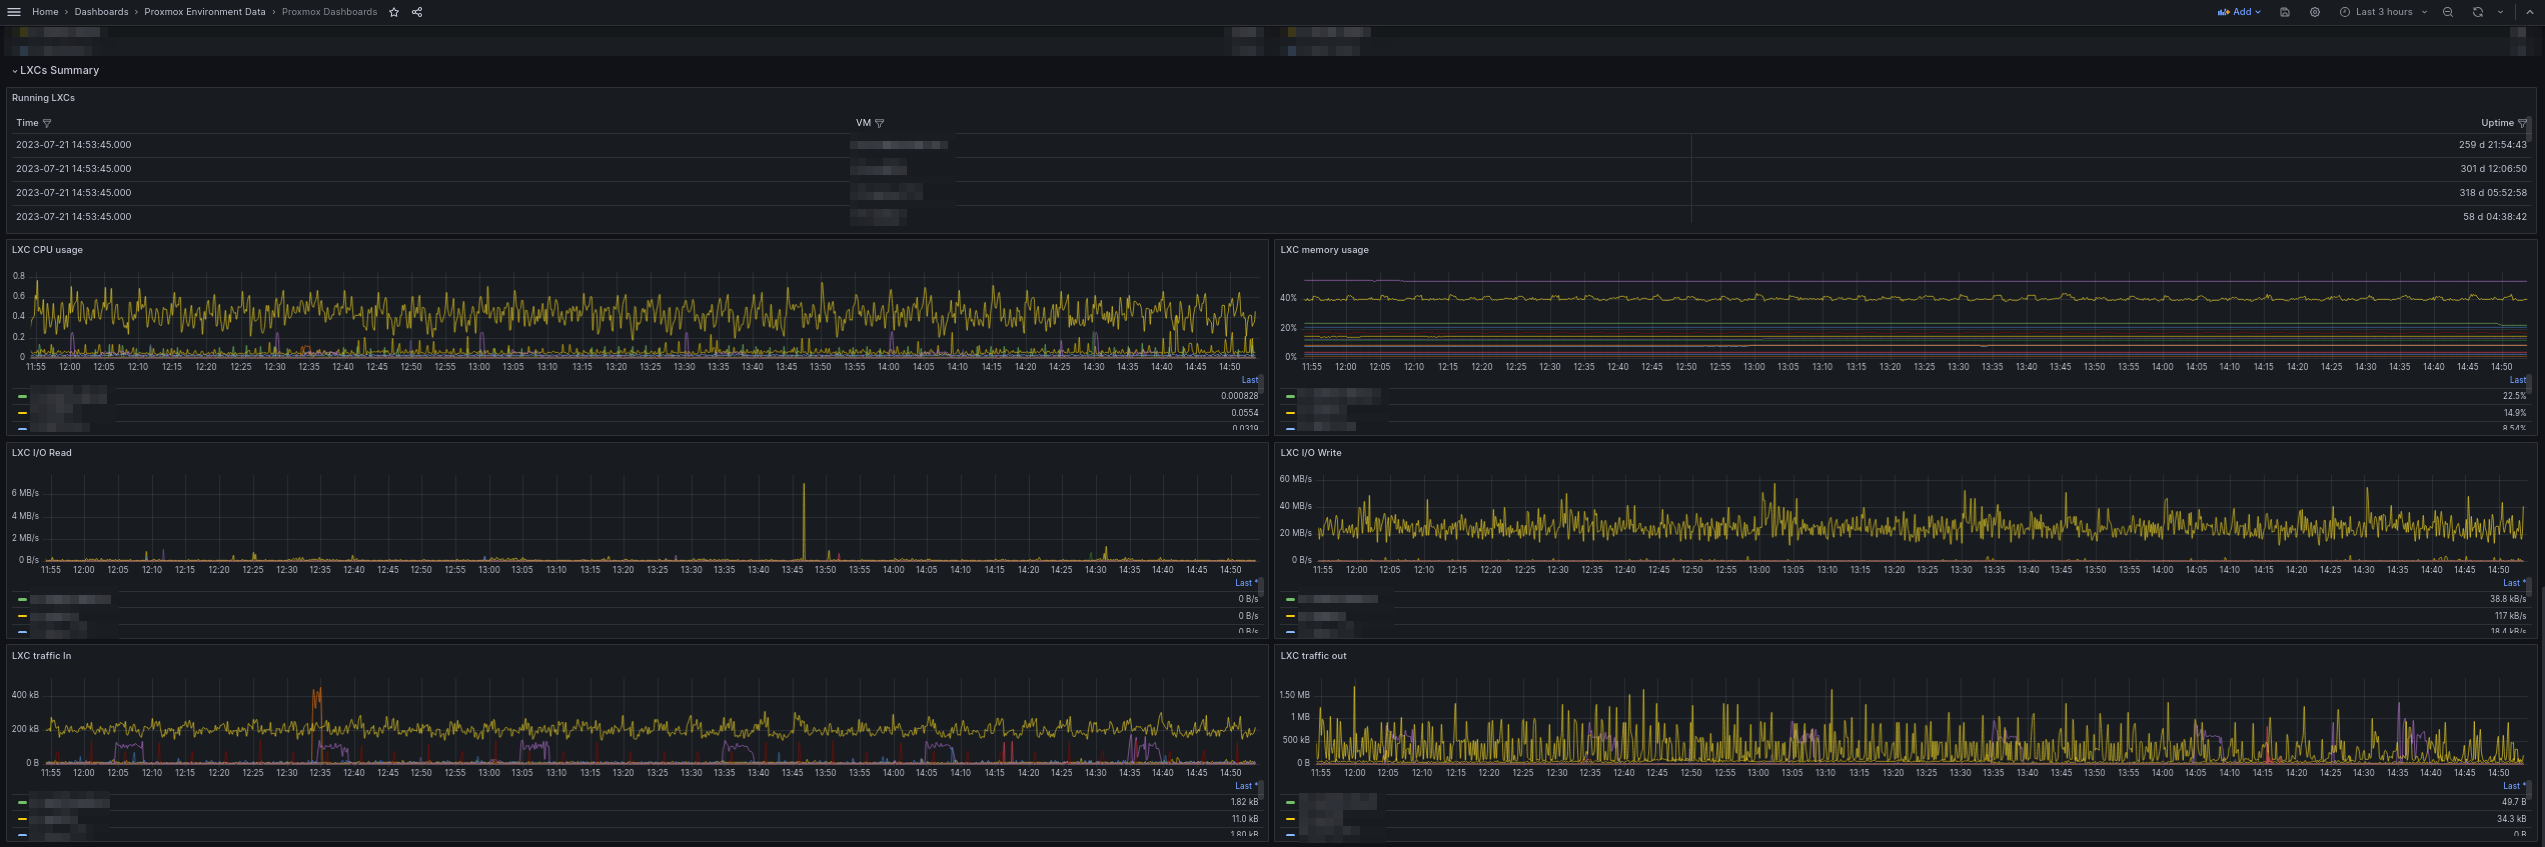
This is a good dashboard to have a first observability of what is happening in all your Proxmox clusters. For this deployment is important to name the InfluxDB and Loki(if you dont want logs then you can make a dummy Loki DS just for the deploy and then delete it) with a location description in the name, for example if you have 3 locations the naming can be like this: "InfluxDB2 - LOC1", "Loki - LOC1", "InfluxDB2 - LOC2", "Loki - LOC2", "InfluxDB2 - LOC3", "Loki - LOC3"
After this you need to go to configuration of the dashboard and walk over all the variables changing some values and doing a "Run query" and "Apply". location: LOC1, LOC2, LOC3 dsProxmox: just Run Query and Apply Bucket: the name of you influxdb2 bucket(has to be the same in all locations) server: just Run Query and Apply dsLoki: just Run Query and Apply
After this save your dashboard and reload de page. You are ready to go. Im open to sugestions, this is a first version, more to come.
Data source config
Collector config:
Upload an updated version of an exported dashboard.json file from Grafana
| Revision | Description | Created | |
|---|---|---|---|
| Download |