DirectAdmin
The Grafana Dashboard for directadmin-exporter displays essential metrics from DirectAdmin, providing a comprehensive overview of the server's health and performance. It includes graphs for the number of users, resellers, domains, subdomains, domain pointers, emails, mailing lists, forwarders, responders, databases, FTP accounts, current load average, email incoming/outgoing statistics, and quota/bandwidth statistics, enabling easy monitoring and analysis of the system's status.
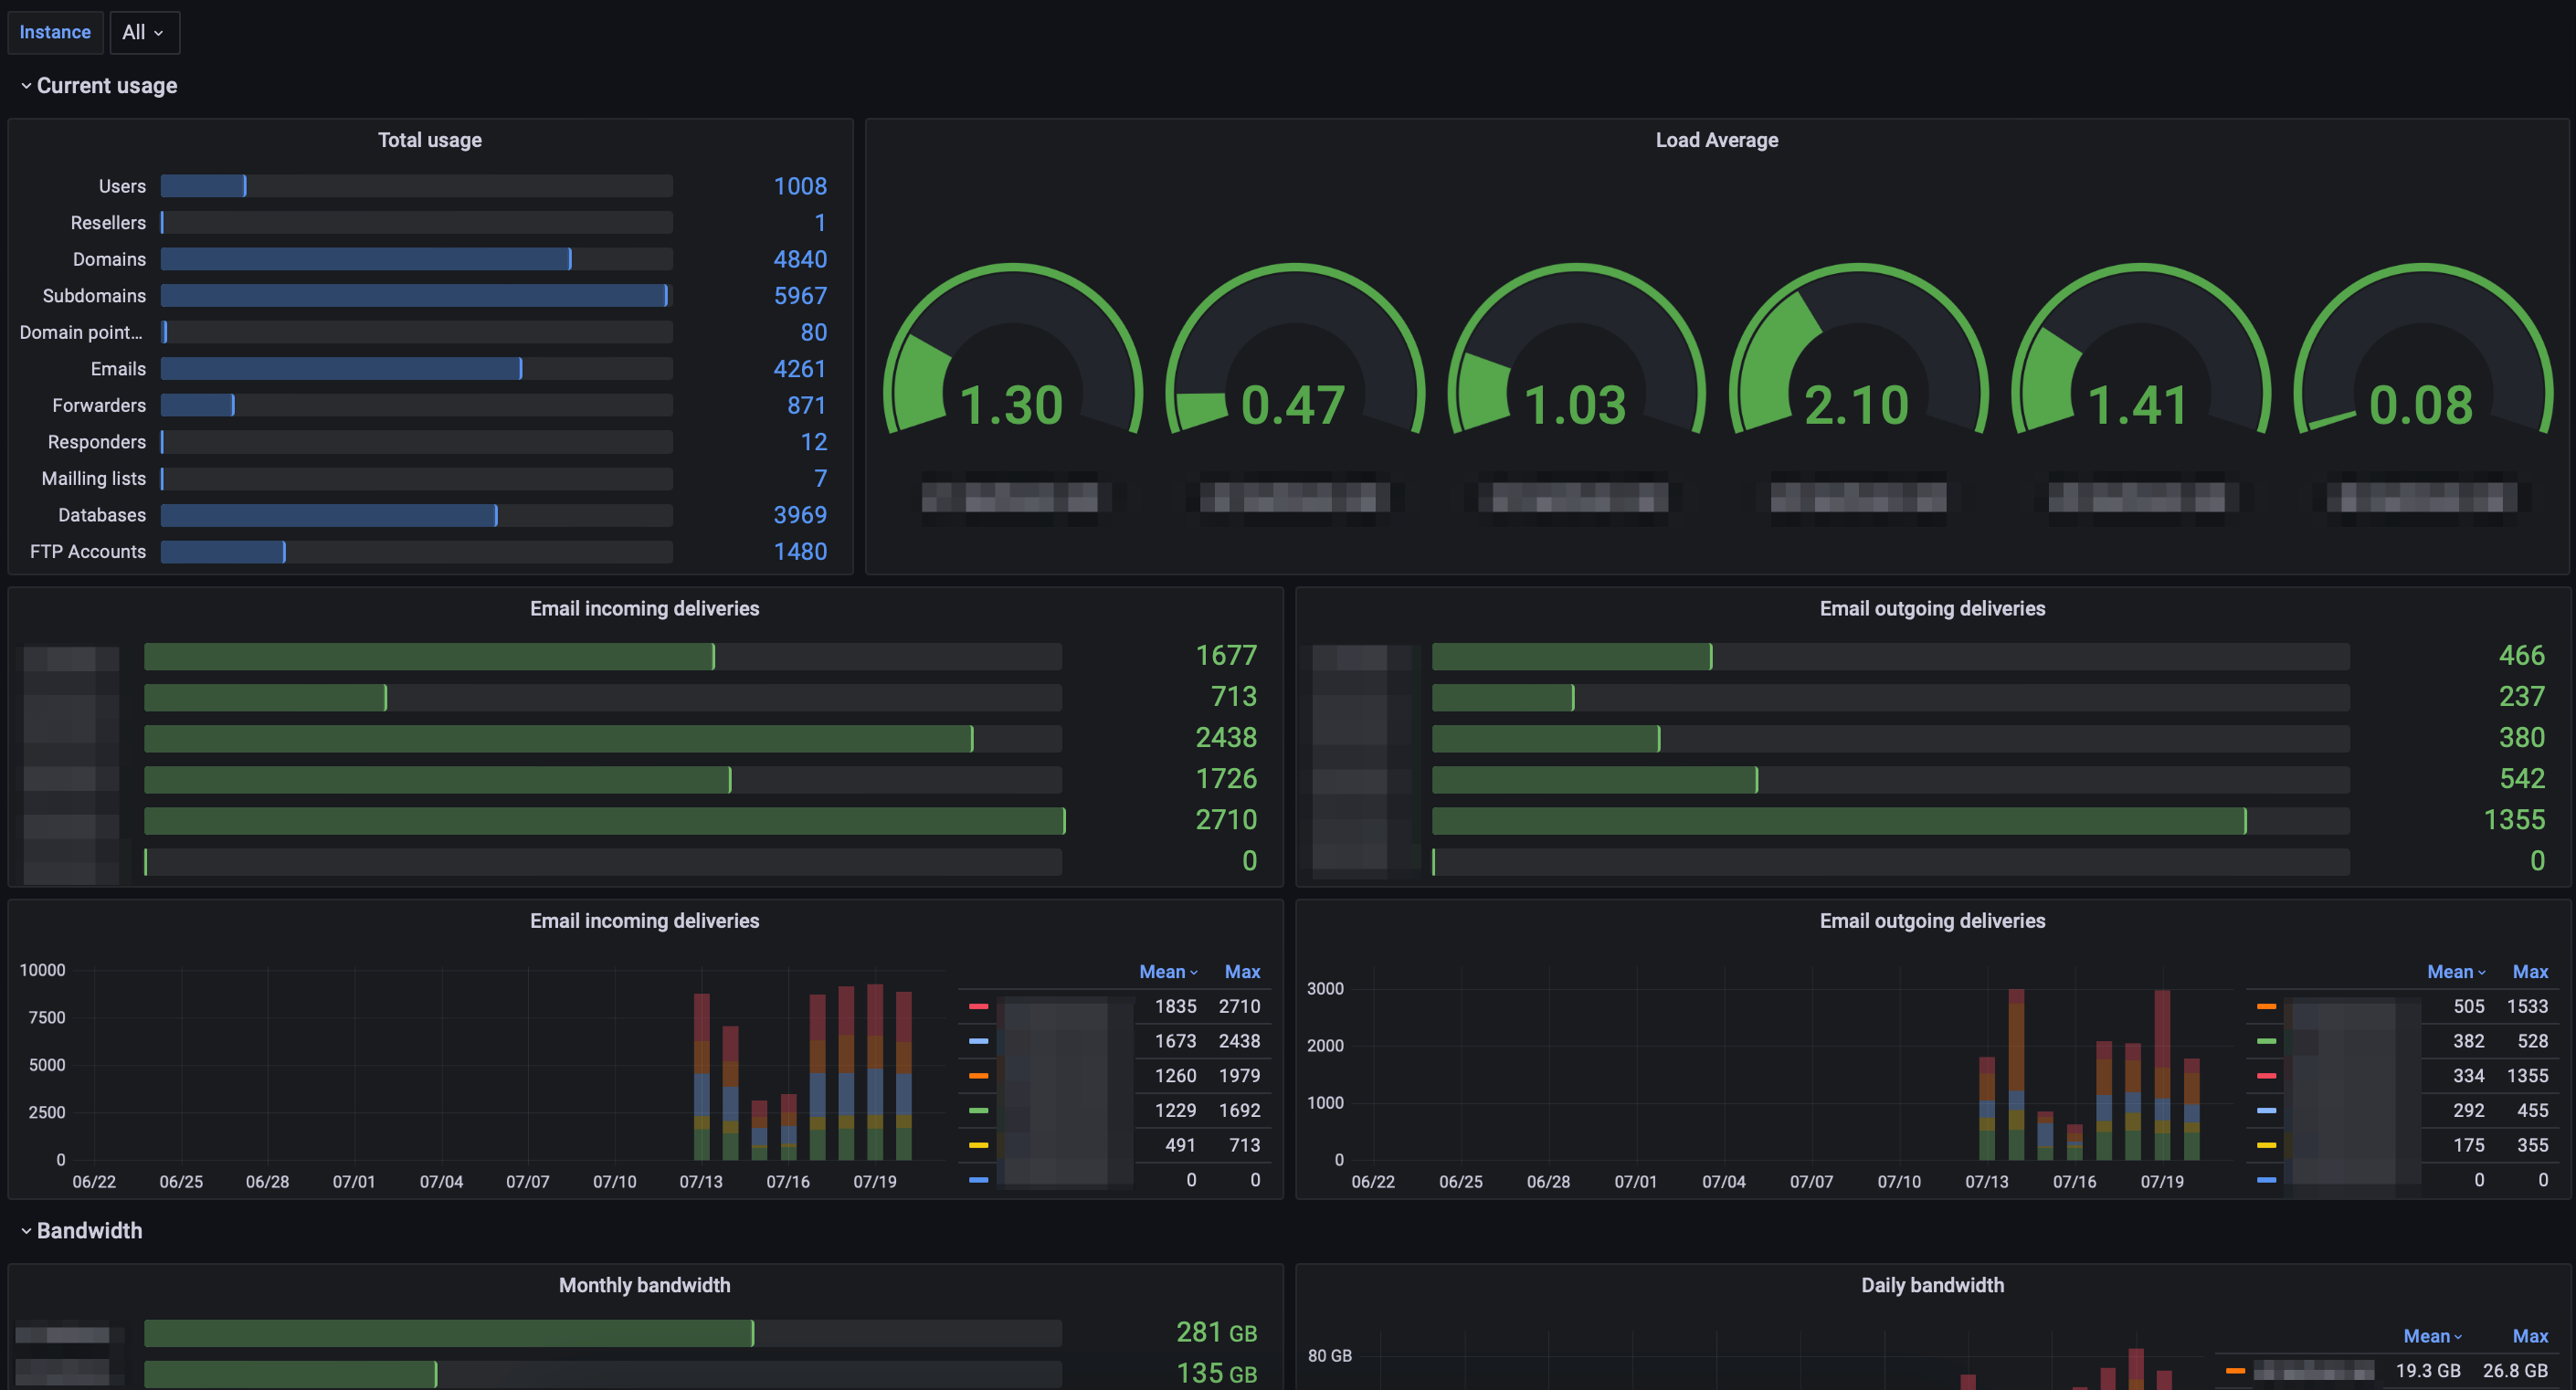
The Grafana Dashboard for directadmin-exporter is a valuable monitoring tool that offers a comprehensive overview of key metrics from your DirectAdmin server. The dashboard utilizes the directadmin-exporter, an open-source Prometheus exporter, to provide insightful visualizations of various crucial performance indicators. This enables system administrators to effectively analyze historical data and gain valuable insights into their server's health and performance.
About directadmin-exporter
directadmin-exporter is an open-source Prometheus exporter specifically designed to scrape essential metrics from DirectAdmin servers. It facilitates seamless integration with Prometheus, allowing for the collection and storage of DirectAdmin metrics over time.
The exporter efficiently fetches metrics using the DirectAdmin API. These metrics include the number of users, resellers, domains, emails, databases, and more, all of which are made available for monitoring through Prometheus.
Metrics Supported
The dashboard supports a wide range of metrics collected by the directadmin-exporter:
Number of Users: Monitor the total number of users on the DirectAdmin server.
Number of Resellers: Keep track of the count of resellers on the server.
Number of Domains: Stay informed about the total number of hosted domains.
Number of Subdomains: Track the count of subdomains set up on the server.
Number of Domain Pointers: Observe the number of domain pointers configured.
Number of Emails: Monitor the total count of email accounts set up.
Number of Mailing Lists: Keep track of the number of mailing lists created.
Number of Forwarders: Stay informed about the total count of email forwarders.
Number of Responders: Observe the number of email auto-responders in use.
Number of Databases: Track the count of databases hosted on the server.
Number of FTP Accounts: Monitor the total number of FTP accounts configured.
Current Load Average (Real-time): Get real-time insights into the server's current load average.
Email Incoming/Outgoing Statistics: Observe statistics related to incoming and outgoing emails.
Quota/Bandwidth Statistics: Keep track of server quota and bandwidth usage statistics.
Instance Variable for Enhanced Filtering
In addition to the diverse range of supported metrics, this Grafana Dashboard introduces an "instance" variable that offers an enhanced filtering feature. With this capability, system administrators can easily focus on specific instances of DirectAdmin servers, making it an ideal choice for monitoring multiple servers from a centralized Grafana instance.
By using the "instance" variable, administrators can seamlessly switch between different DirectAdmin server instances and compare their performance metrics side-by-side. This feature is particularly beneficial for organizations with multiple servers or for service providers managing clients on separate DirectAdmin instances.
Historical Data Analysis
While real-time monitoring is available for the current load average, the majority of metrics in this dashboard provide historical data analysis. This means that the dashboard allows administrators to assess server performance over time, enabling them to identify trends, patterns, and historical peaks in resource usage. Analyzing historical data is critical for capacity planning, performance optimization, and identifying long-term trends in server utilization.
In conclusion, this comprehensive and customizable Grafana Dashboard, along with the powerful directadmin-exporter, provides an indispensable tool for system administrators to gain valuable insights into their DirectAdmin infrastructure's health and performance. The "instance" variable enhances its capabilities, making it a preferred choice for organizations seeking effective historical monitoring and performance analysis.
Data source config
Collector config:
Upload an updated version of an exported dashboard.json file from Grafana
| Revision | Description | Created | |
|---|---|---|---|
| Download |