z/VM Virtual Switch Activity
Shows activity for Virtual Switch and Guest LAN with virtual NICs connected
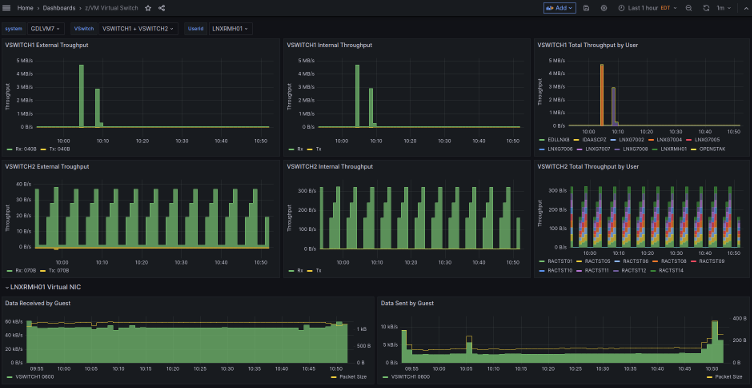
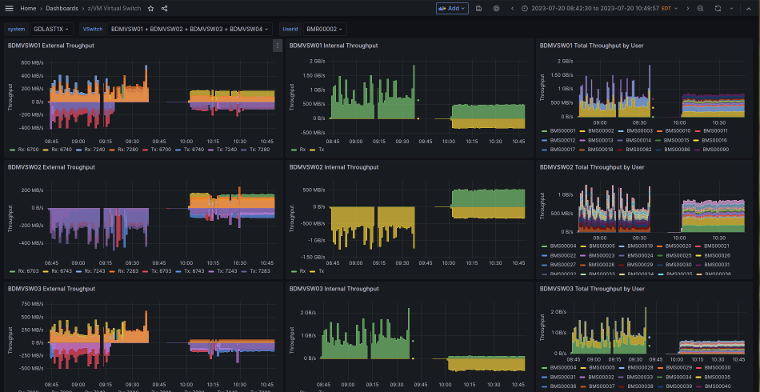
The dashboard shows throughput of z/VM® Virtual Switch used to provide network connectivity to guests. For each of the selected virtual switches, charts show inbound and outbound traffic over time, for the external interfaces as well as aggregated for all connected virtual network interfaces.
In addition, a chart shows the breakdown of internal traffic by Linux guest. For selected Linux guests, the throughput is shown by virtual switch, both inbound and outbound.
The default configuration of the z/VM Performance Data Pump collects the metrics used in the dashboard.
This dashboard is licensed by IBM under the Apache 2.0 License and is provided ‘as is’ without warranty, representation, support, maintenance or an obligation to issue updates.
Data source config
Collector config:
Upload an updated version of an exported dashboard.json file from Grafana
| Revision | Description | Created | |
|---|---|---|---|
| Download |
Java Virtual Machine (JVM)
Easily monitor a Java virtual machine, which allows computers to run Java programs, with Grafana Cloud's out-of-the-box monitoring solution.
Learn more

