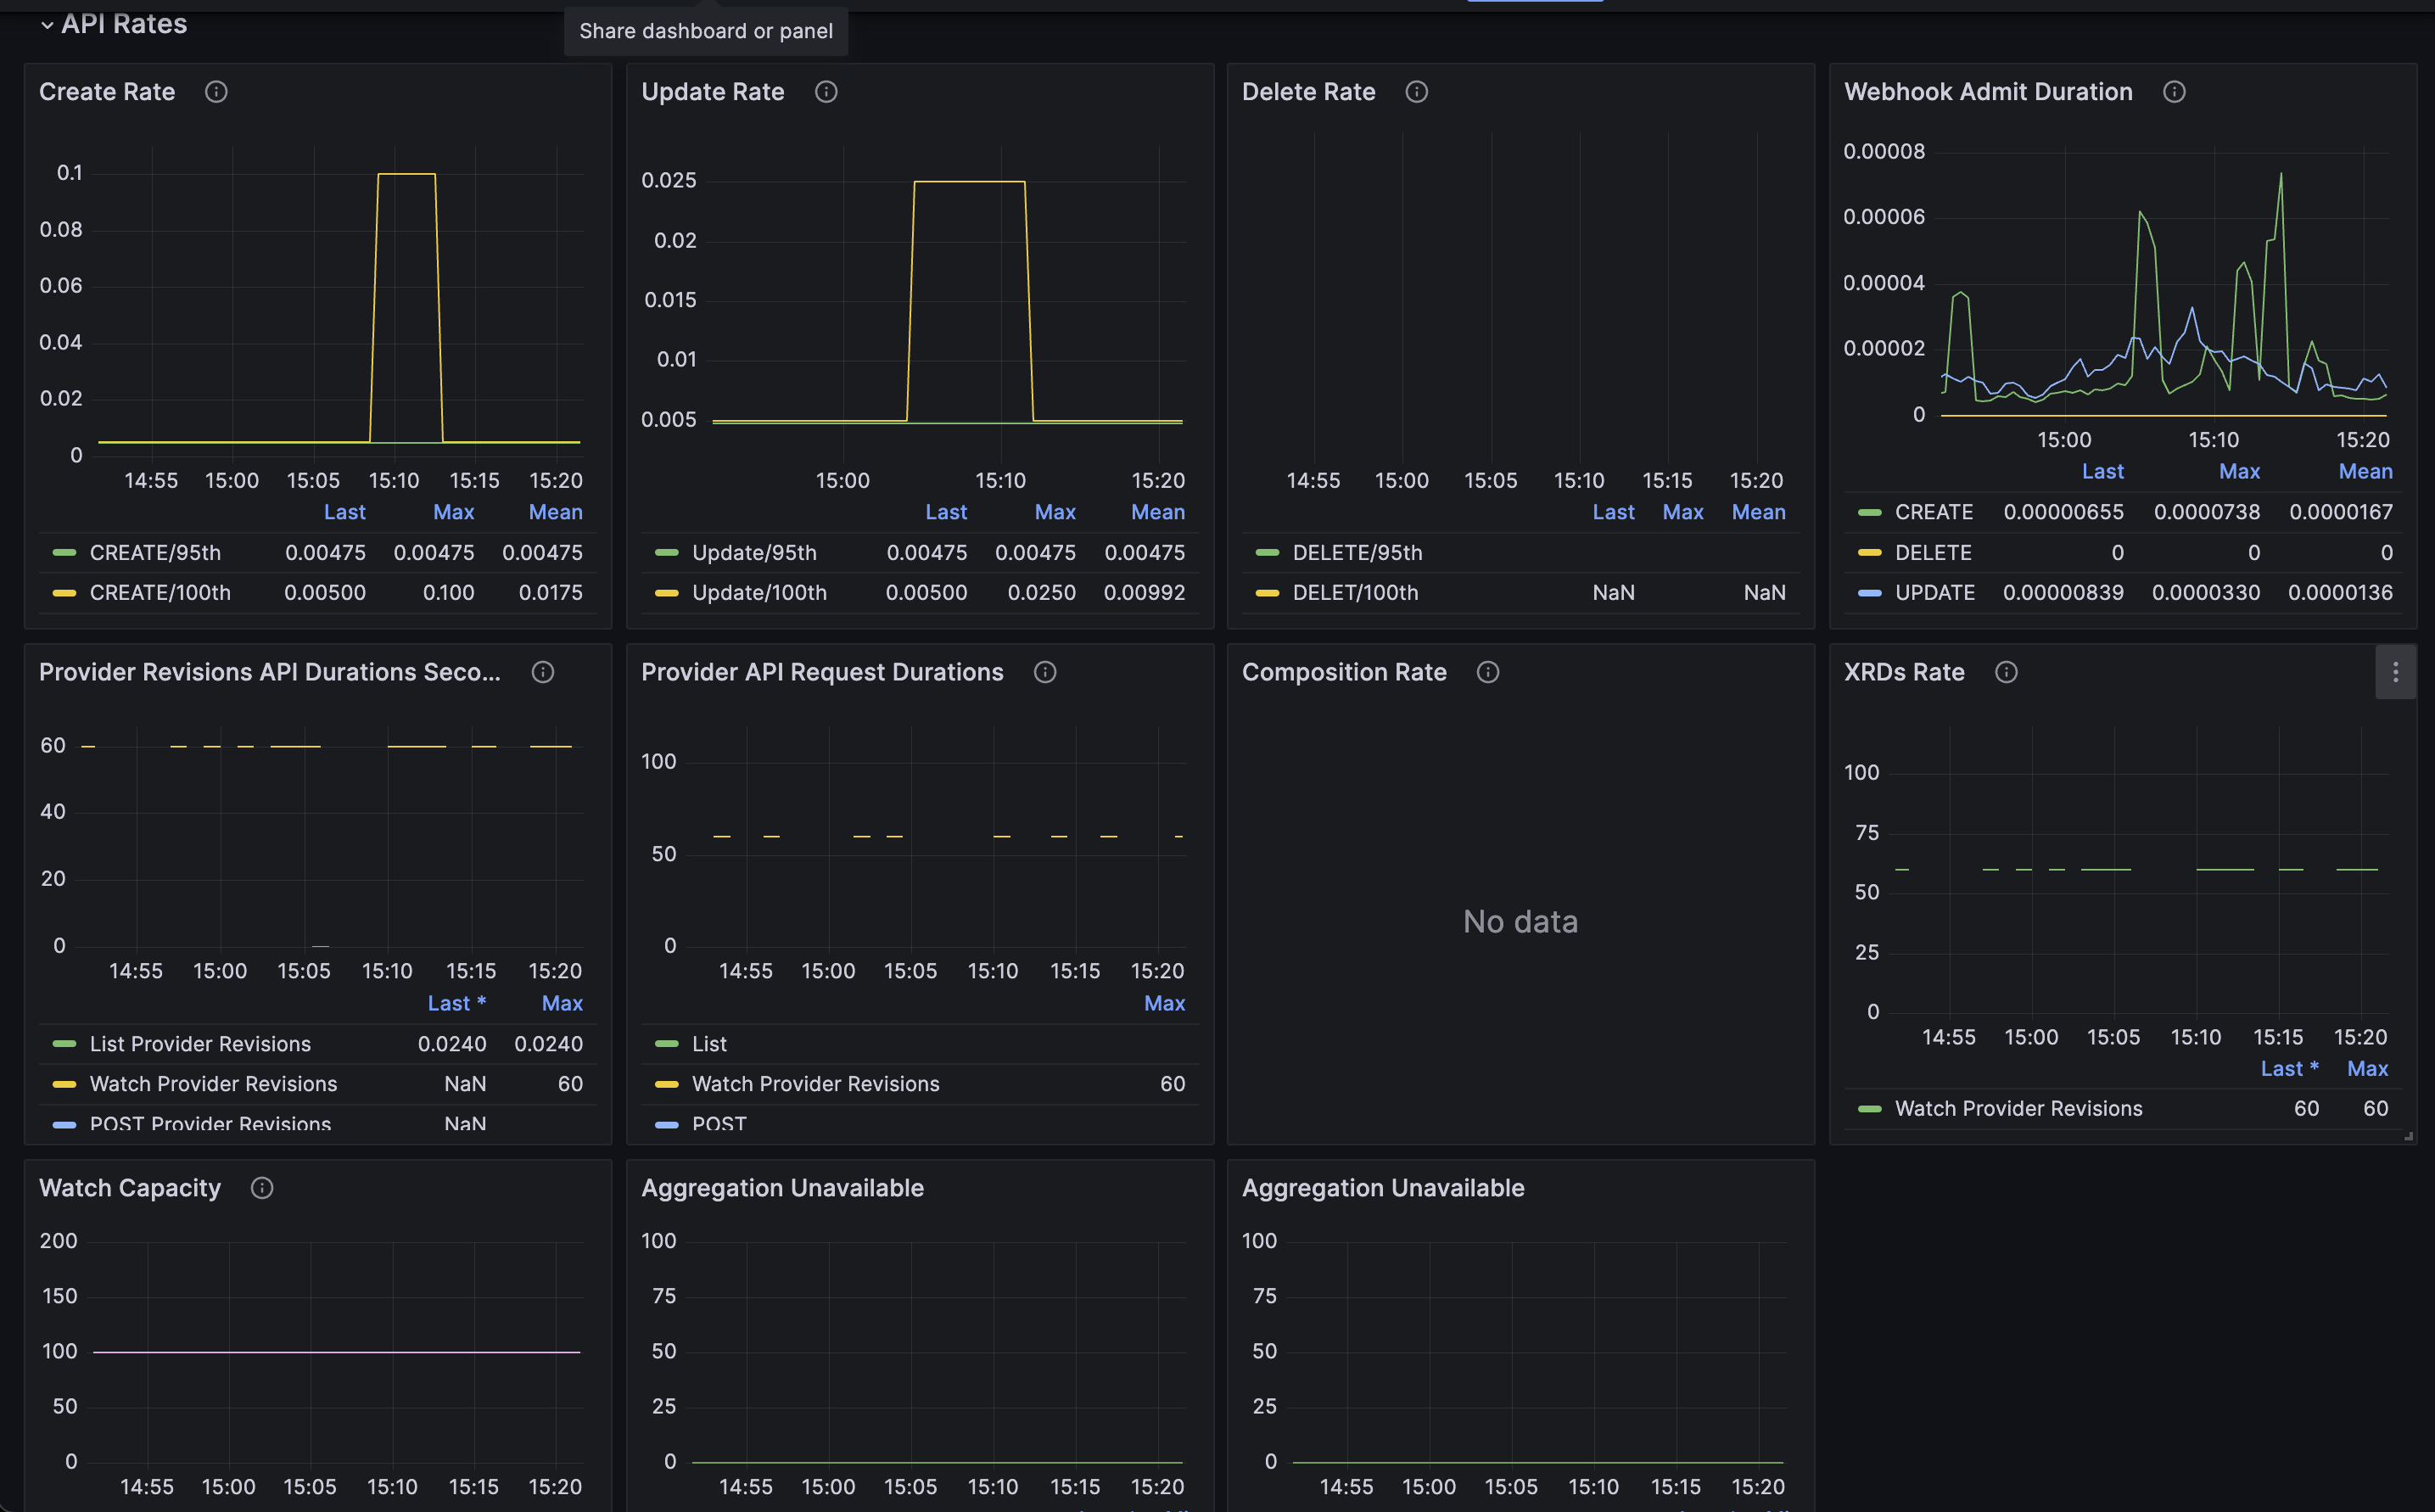
Upbound Space Metrics
Upbound Spaces Metrics

Setup
Control planes are isolated using network policies restricting network traffic to Crossplane and within the Space. Metrics are collected by Vector. In order to scrape Vector, Prometheus must be installed in either the monitoring or prometheus namespace.
For example:
helm repo add prometheus-community https://prometheus-community.github.io/helm-charts
helm repo update
helm -n monitoring --create-namespace monitoring prometheus-community/prometheus
After Prometheus is setup, apply the following service montior:
kubectl apply -f -<<EOM
---
apiVersion: monitoring.coreos.com/v1
kind: ServiceMonitor
metadata:
  labels:
    # this is the default label used by the prometheus operator to determine which services
    # to scrape. You may need to adjust labels depending on your installation.
    release: prometheus
  name: kube-state-metrics
  namespace: monitoring
spec:
  endpoints:
  - honorLabels: true
    path: /metrics
    port: http
    scheme: http
    scrapeTimeout: 10s
  namespaceSelector:
    any: true
  selector:
    matchLabels:
      app.kubernetes.io/name: kube-state-metrics
      app.kubernetes.io/component: metrics
      app.kubernetes.io/instance: kube-state-metrics
---
apiVersion: monitoring.coreos.com/v1
kind: ServiceMonitor
metadata:
  labels:
    # this is the default label used by the prometheus operator to determine which services
    # to scrape. You may need to adjust labels depending on your installation.
    release: prometheus
  name: mxp-gateway-metrics
  namespace: monitoring
spec:
  endpoints:
  - honorLabels: true
    path: /metrics
    port: metrics
    scheme: http
    scrapeTimeout: 10s
  - relabelings:
    - action: labeldrop
      regex: pod
    - action: labeldrop
      regex: service
    - action: labeldrop
      regex: instance
  namespaceSelector:
    any: true
  selector:
    matchLabels:
      app.kubernetes.io/name: mxp-gateway
      vcluster.loft.sh/managed-by: vcluster
      vcluster.loft.sh/namespace: upbound-system
---
apiVersion: monitoring.coreos.com/v1
kind: ServiceMonitor
metadata:
  labels:
    # this is the default label used by the prometheus operator to determine which services
    # to scrape. You may need to adjust labels depending on your installation.
    release: prometheus
  name: space-metrics
  namespace: monitoring
spec:
  endpoints:
  - honorLabels: true
    path: /metrics
    port: metrics
    scheme: http
    scrapeTimeout: 10s
  - relabelings:
    - action: labeldrop
      regex: pod
    - action: labeldrop
      regex: service
    - action: labeldrop
      regex: instance
  namespaceSelector:
    any: true
  selector:
    matchLabels:
      app.kubernetes.io/name: otlp-collector
      vcluster.loft.sh/managed-by: vcluster
      vcluster.loft.sh/namespace: upbound-system
EOM
Data source config
Collector type:
Collector plugins:
Collector config:
Revisions
Upload an updated version of an exported dashboard.json file from Grafana
| Revision | Description | Created | |
|---|---|---|---|
| Download |